Working Capital Ratio Meaning
The working capital ratio is the ratio that helps in assessing the financial performance and the health of the company, where a ratio of less than 1 indicates the probability of financial or liquidity problems in the future for the company. It is calculated by dividing the total current assets of the company with its total current liabilities.
The net working capital ratio, a key financial metric, measures a company’s short-term liquidity and ability to cover its immediate liabilities. It’s a crucial indicator of financial health, helping stakeholders assess an organization’s operational efficiency and sustainability. A high ratio indicates ample liquidity, while a low one may signal potential financial stress.
Key Takeaways
- The working capital ratio assesses a company’s financial health by dividing current assets by current liabilities. A ratio below one may indicate economic or liquidity issues.
- A working capital ratio between 1.2 to 1.8 suggests a healthy financial status. A ratio below one signals negative working capital, where the company may struggle to meet liabilities and face bankruptcy risks.
- A ratio higher than two may indicate excess unused funds, which can be costly. Maintaining an appropriate working capital ratio is crucial for optimal financial management and efficient use of resources.
Working Capital Ratio Explained
The working capital ratio, often referred to as the current ratio, is a fundamental financial metric that plays a vital role in assessing a company’s short-term financial health and operational efficiency. It provides valuable insights into an organization’s ability to meet its short-term obligations and manage its day-to-day operations effectively.
The working capital ratio is calculated by dividing a company’s current assets by its current liabilities. Current assets include cash, accounts receivable, inventory, and other assets that are expected to be converted into cash within a year. Current liabilities encompass short-term obligations such as accounts payable, short-term debt, and other liabilities due within the next 12 months.
A ratio above 1 indicates that the company has more current assets than current liabilities, signifying a healthy liquidity position. This means that the company is well-positioned to meet its short-term financial obligations. Conversely, a ratio below 1 suggests that the company may face difficulties in covering its short-term liabilities and may need to rely on external financing or asset liquidation.
For investors and creditors, the working capital ratio serves as a crucial indicator of an organization’s financial stability and its ability to repay debts. A higher ratio generally instills confidence, as it implies a cushion of liquidity, reducing the risk of default. However, an excessively high ratio may also indicate that the company is not efficiently utilizing its resources. On the other hand, a low ratio may raise concerns about financial risk and the company’s ability to meet its obligations on time.
Hence, the working capital ratio analysis is a significant tool for assessing the short-term financial viability and liquidity of a company. It helps management make informed decisions about resource allocation, and it assists investors and creditors in evaluating an organization’s creditworthiness and financial stability.
Working Capital Ratio Video

Formula
Let us understand the formula that shall act as a basis to find the net working capital ratio through the discussion below.
Working Capital Ratio = Current Assets ÷ Current Liabilities
Generally speaking, it can be interpreted as follows:
- If this ratio is around 1.2 to 1.8 – This is generally said to be a balanced ratio, and it is assumed that the company is in a healthy state to pay its liabilities.
- If it is less than 1 – It is known as negative working capital, which generally means that the company cannot pay its liabilities. A consistently negative working capital may also lead to bankruptcy. (Detailed explanation is given in a later segment)
- If this ratio is greater than 2 – the Company may have excess and idle funds that are not utilized well. It should not be the case as the opportunity cost of idle funds is also high.
However, these ratios generally differ with the industry type and will not always make sense.
Examples
Now that we understand the basics, formula, and related factors of working capital ratio analysis, let us apply the theoretical knowledge to practical application through the examples below.
Example #1
LMN Corporation’s management decided to undergo a series of infrastructural developments. However, it came to light much later that the company did not have the desired amount of funds at its disposal for such an extensive expansion.
The top management of the company came together to assess the situation. They found that the account receivables and the other current assets were at $600,000. However, the infrastructural development project would cost them approximately $1 million.
To ensure the company could function and did not go bankrupt, they decided to put a hold on the developmental activities until they had sufficient funds and employed the funds at their disposal to procure raw materials and marketing instead.
Example #2
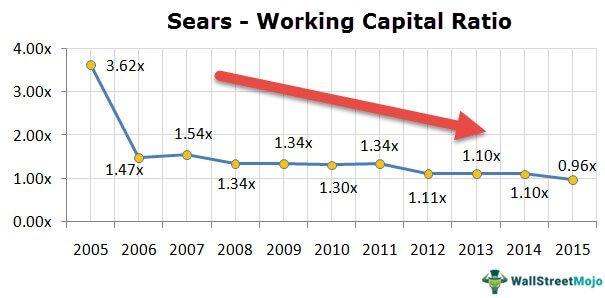
Sears Holding stock fell by 9.8% due to continuing losses and poor quarterly results. Sears’s balance doesn’t look too good, either. Moneymorning has named Sears Holding one of the five companies that may go bankrupt soon.
Especially if you check the working capital situation of Sears Holdings and calculate the working capital ratio, you will note that this ratio has been decreasing continuously for the past ten years or so. This ratio below 1.0x is not good.
Components
Let us look at the critical components of working capital ratio – Current Assets and Current Liabilities.
Current Assets:
Current assets include cash and other assets that can convert to cash within a year.

source: Colgate 2015 10K
Examples of current assets are:
- Short term investment in mutual funds
- Accounts receivable
- Inventory (Consists of raw materials, work-in-progress and finished goods)
- Bank balance
Current Liabilities:
The company will have to pay these current liabilities within a year.

source: Colgate 2015 10K
Examples of current liabilities are:
- Accounts payable
- Notes payable (due within a year)
- Other expenses are generally payable in a month’s time, such as a salary, material supply, etc.
Let us calculate and conduct a working capital ratio analysisfor Colgate from the images above.
Here, Current Assets = Cash and Cash Equivalents + Accounts Receivables + Inventories + Other Current Assets
- Current Assets (2015) = $970 + $1,427 + $1,180 + $807 = $4,384
Current Liabilities = Notes and loans payable + Current portion of long term debt + Accounts Payable + Accrued Income Taxes + Other Accruals
- Current Liabilities (2015) = $4 + $298 + $1,110 + $277 + $1,845 = $3,534
Working Capital (2015) = Current Assets (2015) – Current Liabilities (2015)
- Working Capital (2015) = $4,384 – $3,534 = $850
- Working Capital Ratio (2015) = $4,384 / $3,534 = 1.24x
This ratio is also known as Current Ratio
Changes in Working Capital Ratio
As explained above, the net working capital ratio is a dynamic figure and keeps changing with the change in both assets/liabilities. The following table summarizes the effects of changes in individual components of working capital:
| Components of Working Capital | Change | Effect on Working Capital |
|---|---|---|
| Current Assets | Increase | Increase |
| Decrease | Decrease | |
| Current Liabilities | Increase | Decrease |
| Decrease | Increase |
Working Capital vs Liquidity
As discussed earlier, working capital is the difference between its current assets and liabilities. These are stand-alone financial figures obtained from a company balance sheet. It is not proof of a company’s liquidity position.
Let us understand this with the help of an example:
| Particulars | Company WC | Company Liquid |
|---|---|---|
| Current Assets | 500 | 1000 |
| Current Liabilities | 500 | 500 |
| Working Capital Ratio | 1:1 | 2:1 |
In the above case, Company Liquid seems to be more liquid as compared to Company WC. Now, let us include some more details to the above table
| Particulars | Company WC | Company Liquid |
|---|---|---|
| Average collection period (A/cs Receivable) | 30 days | 120 days |
| Average payment period (A/cs Payable) | 60 days | 90 days |
Taking the above two stats, it is clear that Company WC will be able to generate cash in a more efficient way rather than Company Liquid. Working Capital Ratio alone is not sufficient to determine liquidity. The following other financial indicators are also required:
- Days inventory outstanding formula = Cost of sales per day ÷ Average inventories
- Days sales outstanding formula = Net sales per day ÷ Average Accounts Receivable
- Days payable outstanding formula = Cost of sales per day ÷ Average Accounts Payable
These measures the respective turnovers, e.g., days inventory outstanding means how many times the inventory was sold and replaced in a given year.
The three of the above indicators can measure the Cash Conversion Cycle (CCC), which tells the number of days it takes to convert net current assets into cash. Longer the cycle, the longer the business has its funds utilized as working capital without earning a return. So the business should aim to minimize the CCC as much as possible.
Cash Conversion Cycle (CCC) = Days inventory outstanding + Days sales outstanding – Days payable outstanding
The Cash Conversion Cycle (CCC) will be a better measure to determine the company’s liquidity rather than its working capital ratio.
Frequently Asked Questions (FAQs)
1. What is the importance of the working capital ratio?
The working capital ratio is crucial for assessing a company’s short-term financial health. It measures the firm’s ability to cover its current liabilities using its current assets. A high working capital ratio indicates better liquidity and financial stability, while a low ratio may signal potential cash flow issues.
2. What are the applications of the working capital ratio?
The working capital ratio finds extensive applications in financial analysis and decision-making. Investors and creditors use it to evaluate a company’s liquidity and risk profile. Management relies on this ratio to optimize working capital management, ensuring smooth day-to-day operations and meeting short-term obligations.
3. What are the limitations of the working capital ratio?
Despite its significance, the working capital ratio has certain limitations. It solely focuses on the short-term financial position, ignoring long-term aspects. Additionally, it doesn’t provide insights into the efficiency of individual components within current assets and liabilities, and industry norms may vary, making comparisons challenging.
Recommended Articles
This article has been a guide to Working Capital Ratio and its meaning. Here, we explain the formula, components, and examples and compare it with liquidity. You can learn more about important metrics through: