What is Price to Cash Flow Ratio?
Price to Cash Flow Ratio is the value indicator that pitches the current market price of the share to the operational cash flow so as to represent what percentage of the price is explained by the cash flow and what percentage isn’t.
In other words, the price to cash flow ratio is one of the most important investment valuation tools and is calculated as the ratio of current stock price to its cash flow from operations per share. In the case of the P/CF ratio, we consider the cash flow from operations, which is the exact measure of how much cash came in and went out from core operations. Many financial experts, therefore, consider this ratio as a more accurate measure of judging the attractiveness of an investment than price to earnings ratio.
Unlike cash flow, earnings can be easily manipulated because earnings (net income) easily get affected by depreciation and other non-cash factors.
Let us have a look at the PE Ratio of Chevron.
Currently, the PE ratio of Chevron is at 149.88x. What do you think about Chevron’s valuation? A definite SELL? However, most of the analysts have given Chevron either a Strong Buy or Buy rating. None of the analysts actually gave Chevron a SELL rating. Are they crazy?
Why did they give BUY ratings to Chevron?
source: Yahoo Finance
Of course, these analysts are looking at ratios beyond Price to Earnings ratio, and in the Oil & Gas sector, other valuation multiples like EV/boe (Enterprise value to barrels of oil equivalent), EV/EBITDA, and Price to Cash Flows become rather important.
From the graph above, we note that Chevron’s P/CF is at around 16.01x.
source: Chevron SEC Filings
We note from Chevron’s Cash flow from operations that Depreciation, Depletion, and Amortization numbers were very high. In fact, in 2015, it was higher than the overall Cash flow from Operations.
Through this price to cash flow ratio, you would be able to compare the cash flow per share with the price per share, which will give you an idea about how much value you would get out of paying the kind of price you are going to pay.
If you want to invest in a company or a project, the P/CF ratio is one of the first ones you should consider calculating.
Formula
To get a thorough idea about this ratio, we need to look at two separate ratios. Understanding these two ratios will help us figure out how to calculate the price to cash flow ratio for an investment.
Let’s look at the price to cash flow ratio first –
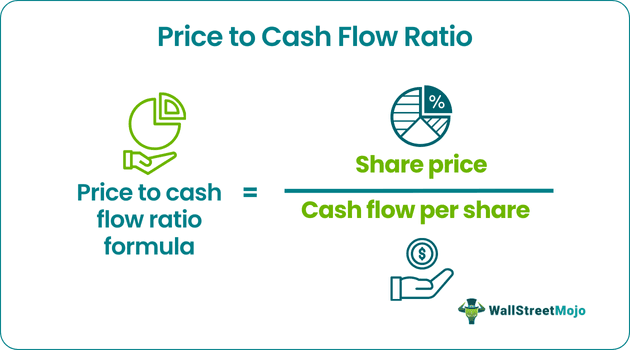
Price to Cash Flow = Share Price / Cash Flow per share.
This ratio is super useful for investors as they can understand whether the company is over-valued or under-valued by using this ratio.
However, to find out this ratio, we need to calculate “cash flow per share.”
To calculate “cash flow per share,” we need two things. First, we need to know the “operating cash flow,” which we will be able to see in the cash flow statement of the company for that period. Second, we need to know the number of “outstanding shares.”
So to calculate, the “cash flow per share,” we would do the following –
Cash flow per share = Operating Cash Flow / Outstanding Shares.
Once we know the cash flow per share, we would be able to calculate the price to cash flow ratio very easily.
To acquire the best knowledge in Financial Modeling and Valuation, unlock our comprehensive online course on the same and earn a certificate.
Interpretation
Many investors get busy in calculating price to earnings ratio. But if you look at the price t earnings ratio, you would see that many companies can manipulate it to attract more investors. For example, as there are many non-cash factors affecting the “net income,” companies that want to manipulate the “net income” can increase or decrease the non-cash factors. Thus, the price to earnings ratio is not always able to provide an accurate picture of a company or of new investment.
However, when we look at the cash flow, it changes the game completely. In the cash flow statement, no non-cash factors would be included. Thus, there is no way one can manipulate the net cash flow at the end of the period. So if we can calculate the “operating cash flow” using the cash flow statement and divide it by the number of “outstanding shares,” then we will get a concrete idea about how much cash flow we can generate per share. Then we can compare the same with the price per share to conclude whether the investment is a good one or not.
If we try to find an optimal level of ratio, then we need to look at a particular sector. For example, if we look at a new technology start-up, its growth would be much faster, resulting in a higher price to cash flow ratio, whereas, if we look at a utility company that is operating for decades, price to cash flow ratio would be much lower. In the case of a technology start-up, as its growth is tremendous, the investors would put more valuation to it than the utility company, which has stable cash flow but fewer opportunities for growth.
Video Explanation Of Cash Flow

Basic Examples
We will look at a few examples so that we can understand the price to cash flow ratio from all angels.
Example # 1
The G Corporation has the following information. Use the information below to find out the price to cash flow ratio.
| Details | In US $ |
|---|---|
| Price per share | 10/share |
| Cash Flow per share | 4/share |
From the example, we can directly calculate this ratio.
| Details | In US $ |
|---|---|
| Price per share (A) | 10/share |
| Cash Flow per share (B) | 4/share |
| P/CF Ratio (A/B) | 2.5 |
Depending on which sector G Corporation belongs, we can compare the price to cash flow ratio and find out whether it is a good number or not.
Example # 2
MNC Company has provided the following information –
| Details | In US $ |
|---|---|
| Price per share | 12/share |
| Operating Cash Flow | 600,000 |
| Outstanding Shares | 500,000 |
calculate Price to Cash Flow Ratio.
In the above, for example, we have two things to calculate. First, we need to calculate the cash flow per share and then the price to cash flow ratio.
Here’s the calculation of cash flow per share –
| Details | In US $ |
|---|---|
| Operating Cash Flow (1) | 600,000 |
| Outstanding Shares (2) | 500,000 |
| Cash Flow per share (1/2) | 1.20/share |
Now we can calculate the P/CFratio –
| Details | In US $ |
|---|---|
| Price per share (A) | 12/share |
| Cash Flow per share (B) | 1.20/share |
| P/CF Ratio (A/B) | 10 |
Again, a similar thing is applicable in this regard as well. Depending on the sector this company belongs to, we need to compare the price to cash flow ratio and find out whether it’s a good number or not.
Example # 3
We have been given the following information by ABC Company –
| Details | In US $ |
|---|---|
| Price per share | 12/share |
| Outstanding Shares | 30,000 |
| Net Income | 70,000 |
| Loss on Sale of Property | 2,000 |
| Decrease in Accounts Receivables | 1,000 |
| Increase in Inventories | 2,000 |
| Increase in Accrued Interest Payable | 700 |
| Increase in Account Payables | 1,000 |
| Deferred Taxes | 500 |
| Depreciation & amortization | 3,000 |
calculate the Operating Cash Flow, Cash Flow per share, and also the P/CF ratio.
From the above example, first, we need to calculate the operating cash flow –
| Details | In US $ |
|---|---|
| Net Income | 70,000 |
| Adjustments: | |
| Depreciation & amortization | 3,000 |
| Deferred Taxes | 500 |
| Decrease in Accounts Receivables | 1,000 |
| Increase in Inventories | (2,000) |
| Increase in Accrued Interest Payable | 700 |
| Increase in Account Payables | 1,000 |
| Loss on Sale of Property | 2,000 |
| Net Cash Flow from Operating Activities | 76,200 |
So now we know that the operating cash flow is the US $76,200.
We also know the number of outstanding shares. So, it would be easier to calculate cash flow per share –
| Details | In US $ |
|---|---|
| Operating Cash Flow (1) | 76,200 |
| Outstanding Shares (2) | 30,000 |
| Cash Flow per share (1/2) | 2.54/share |
Now we would be able to calculate the price to cash flow ratio with ease –
| Details | In US $ |
|---|---|
| Price per share (A) | 12/share |
| Cash Flow per share (B) | 2.54/share |
| Ratio (A/B) | 4.72 |
So the ratio is 4.72. Depending on the sector ABC Company belongs to, we can compare and find out whether 4.72 is a good enough number in regards to price to cash flow ratio or not.
Practical Example – Chevron
Let us now calculate Chevron’s Price to Cash Flow Ratio.![]()
Current Price = $115.60
Chevron P/CF – 2013
- Cash flow from Operations (2013) = $35,002 million
- Number of Shares in 2013 = 1917 million
- Cash Flow Per Share (2013) = 18.25
- P/CF (2013) = 115.60/18.25 = 6.33x
Chevron Price to Cash Flow – 2014
- Cash flow from Operations (2014) = $31,475 million
- Number of Shares in 2014 = 1884 million
- Cash Flow Per Share (2014) = 16.70
- P/CF (2014) = 115.60/16.70 = 6.91x
Chevron Price to Cash Flow – 2015
- Cash flow from Operations (2015) = $19,456 million
- Number of Shares in 2015 = 1886 million
- Cash Flow Per Share (2015) = 10.31
- P/CF (2015) = 115.60/10.31 = 11.20x
Please note that the P/CF that we earlier saw for Chevron (16.01x) is the trailing twelve month Price to Cash Flow.
Oil & Gas Companies
Now that we have a fair understanding of the PCF ratio, let us now compare Oil & Gas companies – Exxon, Chevron, and BP PCF ratio.
We note that for all three companies, the Price to Cash flow ratio has been rising for the past 2-3 years.
Why do you think this is so?

source: ycharts
There has been a slowdown in commodities (Oil) since 2013-2014. Oil prices directly affect their cash flows. Due to lower oil prices, these companies saw a significant decline in their cash flow from operations.

source: ycharts
With this reduced cash flow from operations in the recent quarters, the Price to Cash Flow ratio for these companies who an upward trend (the higher the P/CF ratio, expensive the firm is).
Oil E&P Companies
P/CF is one of the most important tools to value Oil & Gas companies. This is because the best way to measure the Oil company’s performance is to look at its Core Cash Flows. These companies require a large asset base and tend to accumulate high levels of debt to finance capital assets. Increased debt levels mean increased interest and debt repayments. Tracking these core cash flows provides us key insights into the company’s ability to service these debts. (DSCR).
On the other hand, Net income (Net profit) is not a cash measure and can remain steady (or show an increasing trend). However, if cash flows are declining, then it is a clear indication that the company may find it difficult to make its debt repayments.
The table below provides us with Price to Cash Flow ratios (TTM) of top Oil Exploration and Production companies.
| S. No | Name | Market Cap ($ mn) | P/CF (TTM) |
|---|---|---|---|
| 1 | ConocoPhillips | 61,778 | 13.62x |
| 2 | EOG Resources | 60,638 | 26.52x |
| 3 | CNOOC | 57,131 | 4.60x |
| 4 | Occidental Petroleum | 52,523 | 15.29x |
| 5 | Anadarko Petroleum | 39,224 | 16.81x |
| 6 | Canadian Natural | 33,487 | 11.37x |
| 7 | Pioneer Natural Resources | 31,220 | 20.90x |
| 8 | Mitsui & Co | 24,808 | 8.43x |
| 9 | Devon Energy | 24,133 | 9.67x |
| 10 | Apache | 23,608 | 11.09x |
| Average Price / Cash Flow | 13.83x |
as of January 20, 2017
Some important points to note here –
- Average Price to Cash flow ratio of these top companies is around 13.83x
- EOG Resources and Pioneer Natural Resources are the two outliers in this sector, with the P/CF ratio of 26.52x and 20.90, respectively.
- If we remove these outliers, then the Average PCF ratio comes out to be 11.36x
Software Application
Unlike Oil & Gas companies, Software Application companies have an asset-light model. Instead of tangible assets, we find that its assets consist of intangible assets (patents, IPs, copyrights). Another characteristic of Software companies is that they don’t rely heavily on debt (like the Oil & Gas companies). Due to this, Software companies are not valued on the basis of the P/CF ratio.
Instead, analysts use multiples like PE, PEG, EV/EBIT, EV/Customer, etc. to value such companies.
(also, have a look at Enterprise Value vs. Equity Value multiples)
The table below provides us with a Price to Cash Flow ratios (TTM) of top Software Application Companies.
| S. No | Name | Market Cap ($ mn) | Price to Cash Flow (TTM) |
|---|---|---|---|
| 1 | SAP | 110,117 | 23.98x |
| 2 | Adobe Systems | 54,286 | 25.15x |
| 3 | Salesforce.com | 52,650 | 27.75x |
| 4 | Intuit | 29,761 | 21.85x |
| 5 | Dassault Systemes | 19,384 | 28.06x |
| 6 | Autodesk | 17,800 | 55.20x |
| 7 | Check Point Software Tech | 16,850 | 18.09x |
| 8 | Symantec | 16,558 | – |
| 9 | Workday | 16,490 | 47.60x |
| 10 | ServiceNow | 13,728 | 102.65x |
| Average Price / Cash Flow | 38.93x |
source: ycharts
Some important points to note here –
- The average ratio of these top companies is around 38.93x. This is very high.
- Autodesk, Workday, and ServiceNow are the three outliers in the Software application category with P/CF multiple of 55.20x, 47.60x, and 102.65x, respectively.
Utilities
A key characteristic of Utility companies is that they are Capital Intensive Model with steady cash flows and high levels of debt in the balance sheet. As a result, we can apply P/CF to value Utility companies.
The table below provides us with Price to Cash Flow ratios (TTM) of top Utility Companies sorted by Market Capitalization
| S. No | Name | Market Cap ($ mn) | P/CF (TTM) |
|---|---|---|---|
| 1 | NextEra Energy | 55,736 | 8.02x |
| 2 | Duke Energy | 53,131 | 7.74x |
| 3 | Southern | 48,069 | 8.45x |
| 4 | Dominion Resources | 47,395 | 10.46x |
| 5 | National Grid | 45,950 | 6.47x |
| 6 | Exelon | 45,333 | 4.88x |
| 7 | ENEL S.p.A | 44,733 | 3.42x |
| 8 | Exelon | 32,998 | 3.55x |
| 9 | Dominion Resources | 31,494 | 6.95x |
| 10 | PG&E | 30,896 | 7.50x |
| Average Price / Cash Flow | 6.74x |
source: ycharts
- Average Price to a Cashflow ratio of these top Utility companies is around 6.74x
Limitations
There is only one limitation to this ratio. It also has one loophole, and that is this – it doesn’t take capital expenditure into account.
If you want to know a rigorous measure of this ratio, we need to extend beyond price to cash flow ratio (P/CF), and we need to calculate free cash flow and compare it with the price per share.
Free cash flow is the amount of cash flow that is available to business after deducting the Capex. Calculating Free Cash Flow may sound complicated. But here’s the deal
All we need to do is to go back to the income statement of the company and pick net income. Then we need to add back depreciation and amortization as they are non-cash charges. Next, we will take into account any changes in the working capital, and thus, we would get the operating cash flow. From operating cash flow, if we deduct the capital expenditure (new machinery), then we would get free cash flow.
To understand this, we can take an example and illustrate the same.
An Ice Cream Company has an operating cash flow of US $100,000. And now, the company has decided to buy a new refrigerator as the demand for their ice-creams has increased. Thus, they have bought a refrigerator of US $30,000. So what would be the free cash flow of this ice cream company? It would be = US $(100,000 – 30,000) = US $70,000. With the free cash flow of US $70,000, the ice cream company now will be able to pay off its debt (if any) and would be able to bear other expenses.
So finally, what is a more rigorous, accurate ratio? It is the price to free cash flow ratio.
Price to Free Cash Flow = Share Price / Free Cash Flow per share.
All we need to do is to divide the free cash flow by the outstanding shares of the company. And that will give a more accurate picture of whether to invest in a company or not.
In the final analysis
It can be easily said that the price to cash flow ratio is very useful for investors. It gives an almost accurate picture of how good an investment is. And the P/CF is useful because there is little or no chance of manipulation in the cash flow.
If, as an investor, you would like to invest in a new project or a new start-up, use this ratio as the measuring grid. You can also use price to earnings ratio. But the price to cash flow ratio is, by all means, a better measuring grid.