Formula to Calculate Average
Average is the value that is used to represent the set of values of data as is the average calculated from whole data and this formula is calculated by adding all the values of the set given, denoted by summation of X and dividing it by the number of values given in the set denoted by N.
Average = (a1 + a2 + …. + an) / n

- where ai = ith observation
- n = Number of observations
Key Takeaways
- The average is a statistical measure used to determine a dataset’s central tendency or typical value.
- It is commonly employed to summarize data and gain insights into its overall characteristics.
- Various types of averages exist, including the arithmetic mean, median, and mode.
- The arithmetic mean, which is calculated by adding up all the data points and dividing by the number of observations, is the most frequently used average.
- Averages offer concise data representation, providing a single value that can quickly convey information.
- They are useful for identifying trends, understanding data distribution, and comparing different datasets.
Average Formula Explained in Video

Explanation
The calculation of average can be calculated by using the following steps:
- Firstly, determine the observation, and they are denoted by a1, a2, ….., ancorresponding to 1stobservation, 2ndobservation,…., nthobservation.
- Next, determine the number of observations, and it is denoted by n.
- Finally, the average is calculated by adding all the observations and then divide the result by the number of observations, as shown below.
Average = (a1+ a2+ …. + an) / n
Examples
Example #1
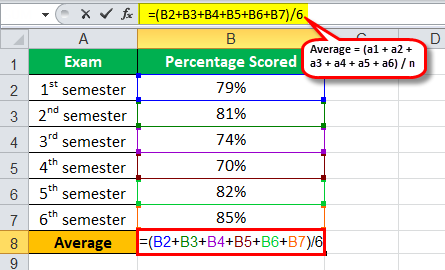
Let us take an example of John, who enrolled in the graduation program for environmental science. The three-year degree course is divided into six semesters, and the final average percentage is calculated based on the percentages scored in all the semesters. Calculate John’s final percentage based on his following score:
Below is given data for calculation of the average percentage.
Given,
a1 = 79%, a2 = 81%, a3 = 74%, a4 = 70%, a5 = 82%, a6 = 85%, n = 6
Using the above information, the calculation of average will be as follows,
- Average = (79% + 81% + 74% + 70% +82% + 85%) / 6
Average will be –
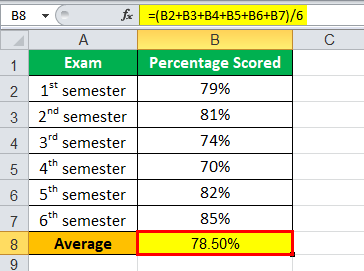
- Average = 78.50%
Therefore, David scored a final percentage of 78.5% in the graduation program.
Uses
As the name “average” suggests, it refers to the central point among a set of observations. When it is utilized in mathematics, it represents the number which is typically the meaning of a group of numbers. The term is often used to express a number, which represents a group of people or things. It is very important because it helps in summarizing a large number of data into a single value, and it also indicates that there is some inconsistency around the single value within the original data, which forms a very crucial part of the central tendency theory.
Frequently Asked Questions (FAQs)
1. What are the types of averages?
The types of averages include the arithmetic mean, which is the sum of values divided by the count; the median, which is the middle value in a sorted dataset; and the mode, which is the most frequently occurring value.
2. What is average vs. weighted average?
The average is calculated by summing and dividing by the count, treating all values equally. Weighted average considers different weights assigned to each value, giving more importance to certain values based on their significance or contribution.
3. What is average vs. percentage?
Average is a statistical measure representing a dataset’s central tendency or typical value. It is calculated by summing the values and dividing by the count. For example, the average of is 20. On the other hand, percentage is a way to express a value as a proportion or fraction of a whole, typically multiplied by 100. It is used to compare parts of a whole or express relative values. For example, if 30 out of 100 students passed an exam, the percentage of students who passed is 30%. Average focuses on summarizing data, while percentage provides a relative comparison or representation.
Recommended Articles
This has been a guide to Average Formula. Here we discuss how to calculate the average using its formula and examples and a downloadable excel template. You can learn more about financing from the following articles –