
Table Of Contents
Excel Pivot Table Add Column
Some advanced PivotTable techniques are essential to go a long way in our careers. However, there is a situation where we need to think out of the box to overcome the challenge in front of us. Usually, we use columns of the data table and build reports, but you might have seen an extract column that is not there in the data table but exists in PivotTable fields. So this is because of the calculated field in PivotTable. This article will show you how to add a new column in the pivot table using the above options.
Let us tell you the scenario we have gone through. First, look at the below image of “Data Table in Excel” and “Pivot Table.”


In the data table, we have only “Sales” and “Cost” columns, but when we look at the PivotTable, we have “Profit” as the extra column. So as new learners, we were just wondering where this new column came from and spent a good amount of days figuring this out.
Knowing this isn't easy, especially if you are learning independently. These new columns in the PivotTable come from calculated fields in pivot table and calculated items.
What is the Calculated Field in Pivot Table?
A calculated field is a custom column or field created using PivotTables existing columns by applying formulas. So, this calculated field is a virtual column for the PivotTable, which does not exist in the actual data table.
For example, look at the PivotTable below.
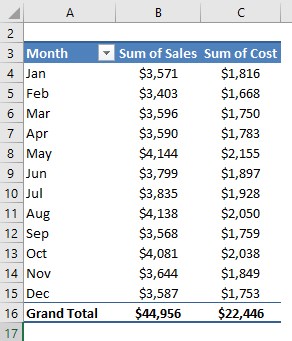
The above table does not have a “Profit” column, usually other than PivotTables. So instead, we insert a new column to arrive at “Profit” by deducting “Cost” from “Sales.”
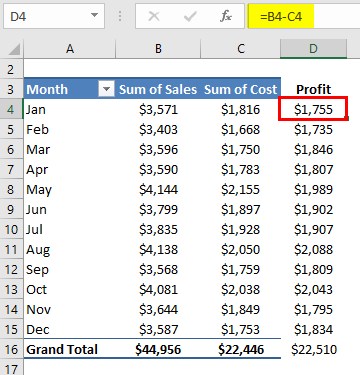
For the PivotTable, only in the next column have we inserted this formula and arrived at the profit column. Still, the problem with this is that the “Profit” column is not part of the PivotTable, so any changes to the fields of the PivotTable will show error values.
For example, we are filtering the first three months.
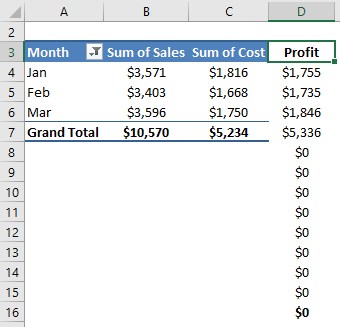
Look at the "Profit" column. Unfortunately, only the first three columns show the values, and other cells still show zero values. So to avoid all these, we create a new virtual column through “Calculated Field.”
Example #1
Using the same formula, we will create a new column.
Follow the below-given steps to add the calculated field in the PivotTable.
- Place a cursor inside the PivotTable, go to the “PivotTable Analyze” tab and click on “Fields, Items & Sets.”

- From the dropdown list, choose “Calculated Field.”

- It will bring up below the insert calculated field window for us.

In the above window, we need to give two things to create a calculated field, “Name & Formula.” So, first, we will provide the field's name and use a formula to make the field.
Since we are creating the column “Profit,” give the same name. - Now, to arrive, the profit formula is “=Sales – Cost,” so use the existing fields and frame the formula.

- Click on “OK” or “Add,” and the new calculated column has been automatically inserted into the PivotTable.

There we have the new virtual column, which is not there in the actual data table.
Example #2
With the above example's continuation, we will insert a “Profit %” column. So to arrive, the “Profit %” formula would be “=Profit / Sales.”
Follow the same steps above and frame the formulas as shown below.
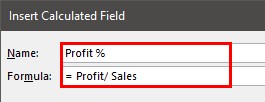
Click on “OK,” and we will have a “Profit %” ready.
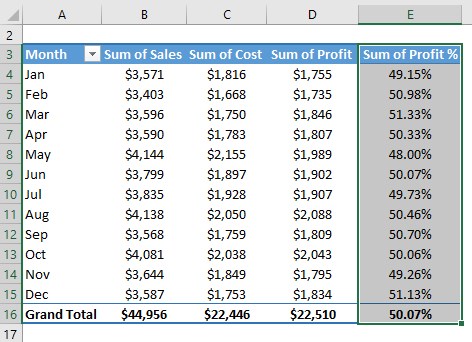
Note: Change the “Profit %” column number format to “%.”
Example #3
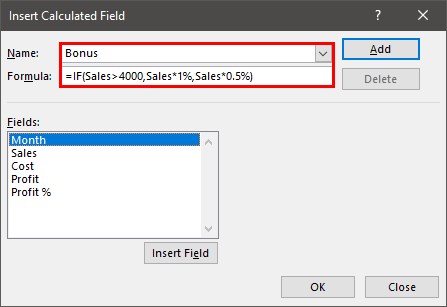
Now for the same PivotTable above, we will create some advanced calculated fields using the IF statement.
For that, the BONUS column calculation would be as follows.
If the sales value is >4000, a bonus is 1% of sales. Otherwise, it would be 0.5%.
So follow the above steps shown above and insert the formula as shown below.
Click on “OK,” and we will have a new “Sum of Bonus” column in the PivotTable.
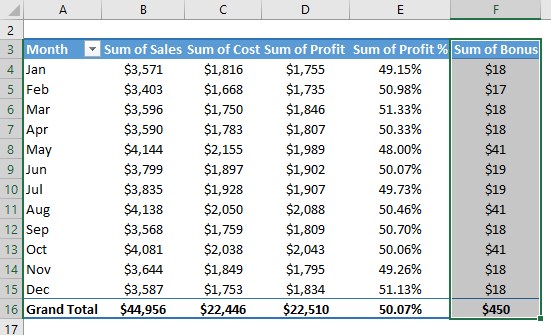
Like this, we can insert columns to the PivotTable using the calculated field.
Things to Remember
- If we do not see the field in the data table, then it must be a calculated field only.
- The calculated fields can be arrived at by using formulas and existing fields of the data table.
