What Is A Pivot Table Slicer?
A Pivot Table Slicer is a tool in MS Excel that helps us filter the data further, and create a smaller PivotTable from the generated main PivotTable. The data can be presented based on various categories with the help of this slicer, as it offers a way to apply the PivotTable filters that dynamically change the view of the PivotTable data.

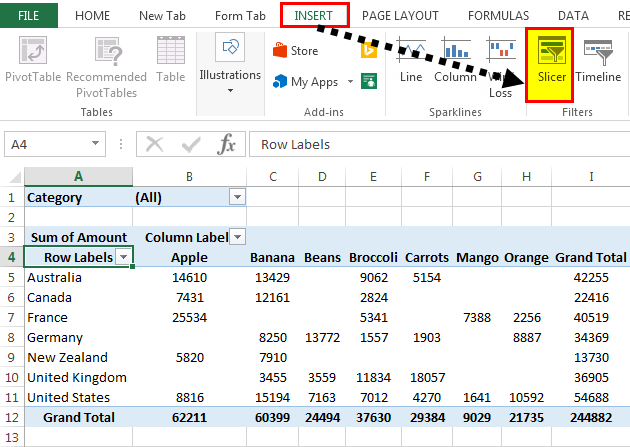
For example, we can create a Pivot Table Slicer after generating a Pivot Table using the “Insert → Slicer” for the required data, as shown below.
Key Takeaways
- Pivot Table Slicers allow us to get a mini-PivotTable of the generated main PivotTable.
- It helps tofilter the data with a visual selection of the item, like name, region, or any sub-category.
- In a PivotTable, when we generate a Slicer, by default, it will filter only that particular PivotTable. However, we can link the slicer to multiple PivotTables and display the impact of any changes.
- Slicer and PivotTables depend on each other when linked using the “Report Connections”. If we filter one value in the PivotTable, it will also filter the same value in the linked slicer.
How To Create A Pivot Table Slicer In Excel?
Following are the steps to create a PivotTable Slicer in excel: –
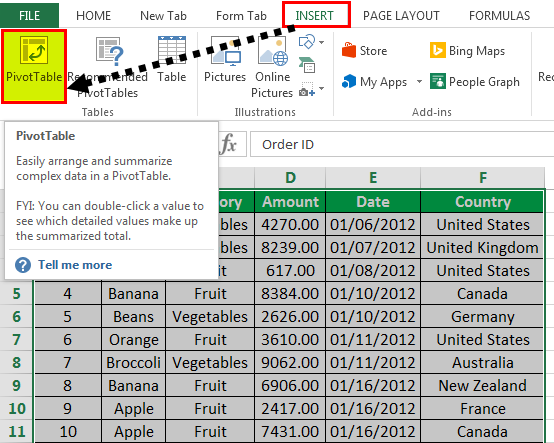
Select the data, go to the “Insert” tab, and click the “PivotTable” option.

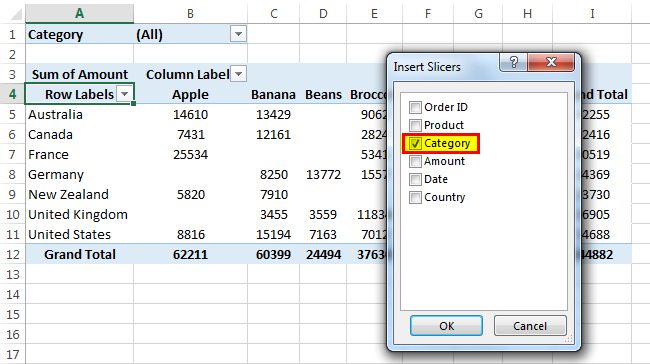
The “PivotTable fields” dialog displays the fields to be added to the resultant report, which is the dataset for the PivotTable Slicer. In addition, the filter section has a column that acts as a table slicer.
The columns field denotes the columns to be displayed. The rows section has the table field whose data should be shown for the selected column. Finally, the values field indicates the actual values to display, which the PivotTable is prepared for, e.g., SUM, PRODUCT, AVERAGE, etc.
Now, a PivotTable is created.

Once the PivotTable is ready, go to Insert → Filters tab → Slicer.


Examples
We will consider some PivotTable Slicer Examples.
This article must help understand Pivot Table Slicers with its formulas and examples. You can download the template here to use it instantly.
Example #1 – Display Fruit-wise Sales for Each Country
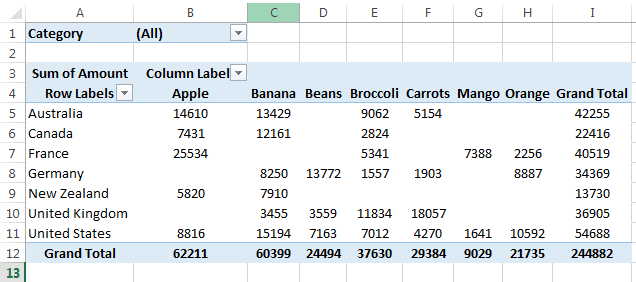
Here, the rows are for each country, and the columns are for each of the fruits, as we need to display the fruit-wise sales figures for each country. Hence, as shown in the figure above, a slicer is created in the category field with two product values: “Fruit” and “Vegetables”. Since we must display the fruit records, we will select “Fruit” from the slicer.
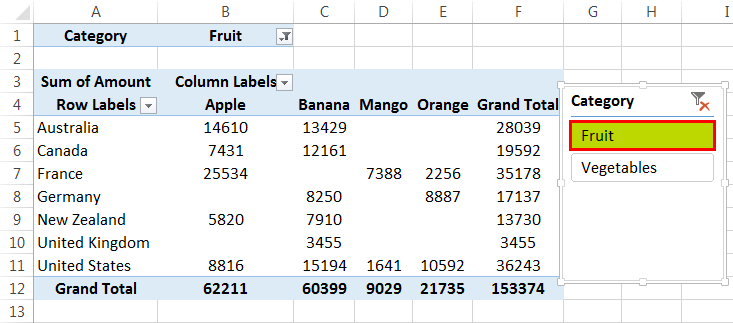
On the right side is the “PivotTable Fields” window. All those fields that must be considered while preparing the PivotTable are checked. E.g., quantity, product, country, and category. For example, “Apple/Banana/Mango” is the “Products”. Whereas “Fruit/Vegetable” is the “Category”.
The “Filters” field has the column selected as “Category”, as we have to choose between fruit or vegetable. The “Rows” section has a “Country”, and the “Columns” section has “Product”. Finally, the “Values” section has the “Sum of Quantity” selected as we have to display the total sales for each fruit across the countries.
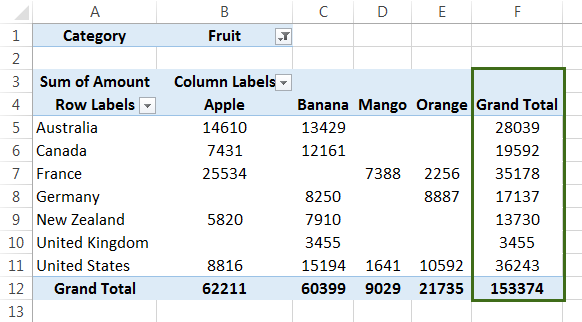
The “Grand Total” column at the end displays the total sales figures for all the fruits for a given country. Likewise, the “Grand Total” row shows the total sales of a given fruit for all the countries.
Example #2 – Monthly Fruit Sales for Each Country
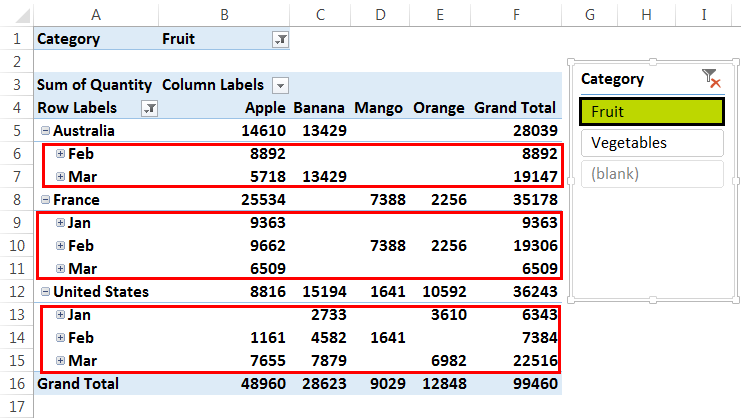
This extension is explained in Example #1 above. As shown in the above figure, it added the “Date” field to the “Fields” to add to the report. Likewise, the “Rows” sections add a “Date” field, as the sales figures for each month are displayed.
Example #3 – Multiple Slicers
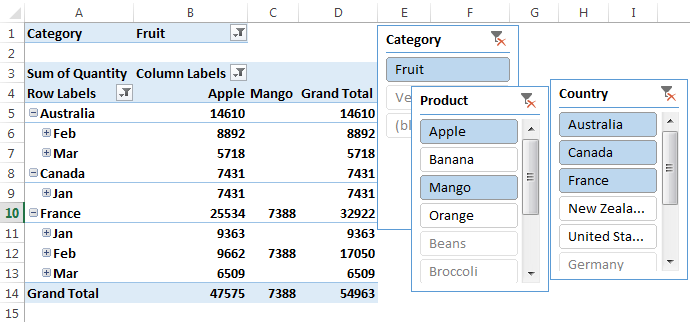
As illustrated in the above figure, multiple slicers are used: the product, country, and category. The “Fruit” is selected from the “Values” category. “Mango” and “Apple” are chosen from the “Product” options. “Australia,” “Canada,” and “France” are selected from “Country” values.
Consequently, the data displayed in the pivot table on the left contains column data for fruit, “Apple,” and “Mango” values. The rows are only for the country options selected.
Important Things To Note
- It is used to create various views from PivotTable in Excel based on the filters and visualize the dataset in the desired format.
- For PivotTable data, there may be one or more table slicers. Ideally, more slicers in the PivotTable and more granular data visualization in Excel are possible.
- A table slicer’s “Fields” or “Values” are multi-selectable.
- Further, we can analyze the data filtered using a slicer.
Frequently Asked Questions (FAQs)
What is the purpose of a PivotTable Slicer?
A Pivot Table Slicer is used to create various views from PivotTable in Excel based on the filters and to visualize the dataset in the desired format.
Also, we can analyze the data filtered using a slicer.
How to format PivotTable slicers in Excel?
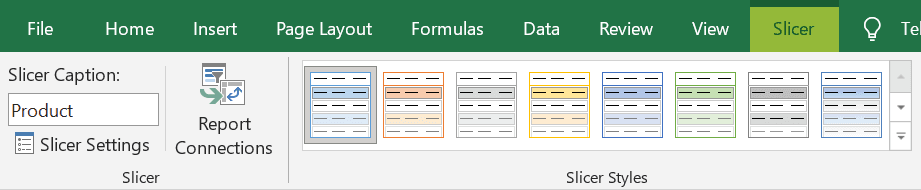
Once the slicer is inserted, click on the Slicer to be formatted.
Then the “Slicer” tab appears on the ribbon, as shown below.
How to connect two PivotTable Slicers in Excel?
To connect two PivotTable Slicers, we must first establish a connection between the PivotTables.
Right-click on the slicer we want to connect, and click on the report connections.
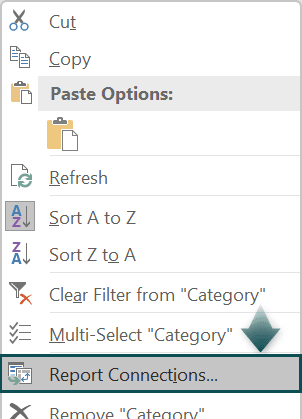
The “Report Connections (Category)” window appears. We can see the list of PivotTables that are connected or not connected to this slicer.
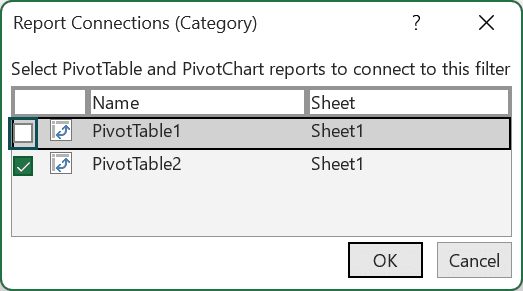
Check/tick the checkboxes of the PivotTable connections to connect the slicers.
Recommended Articles
This article is a guide to Pivot Table Slicer. Here we learn to insert single/multiple slicers in generated Pivot Table, examples, downloadable excel template. You may learn more about Excel from the following articles: –