What Is Excel PivotTable Count Unique?
PivotTable is known for many factors and one of the key elements is that it considers all the rows and shows the data count as those many rows. But in the case of knowing the unique count, we do not have a default option. So, would you like to know how many customers are there instead of how many transactions?
This article will take you through counting unique values in PivotTables.
Key Takeaways
- The PivotTable considers all rows and displays the data count as those many rows, but there is no default option for knowing the unique count.
- When inserting a Pivot Table, ensure that you check the “Add this data to the Data Model” box.
- The “DISTINCT COUNT” summarization type is exclusively available in Excel 2013 and subsequent versions.
What Is Unique Value Mean?
Assume you have gone to one of the supermarkets 5 times to buy groceries in the last month. The supermarket owner wants to know how many customers have come in the previous month. So, the question is, they want to know how many customers have come, not how many times. So, you might have gone 5 times in your case, but the actual customer count is 1, not 5.
How To Get Unique Value In Pivot Table?
Let us learn how to find unique value in PivotTable in Excel with the following detailed examples.
Examples
Example #1
For example, look at the below data.
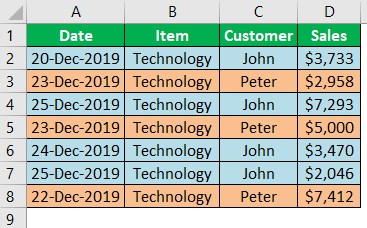
In the above data table, we have two customers, “John” and “Peter,” who went to the supermarket on different dates. Still, when we apply the PivotTable to get the total customer count, we will get the result like the one below.

Upon applying the PivotTable, we got a unique customer count of 7. In comparison, only two customers have come to the supermarket. So, getting a unique count is not straightforward.
It is all about the unique count, but with PivotTable, we do not have this luxury of getting unique values straight away. So, we need to use a different strategy to get the unique count of values.
Note: You need to have Excel 2013 or later versions to use this technique.
Example #2
Take the above-used data only for this example as well.
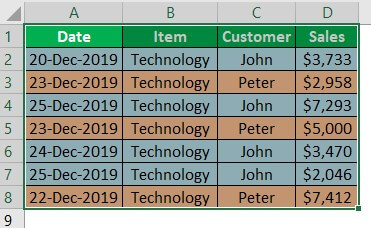
Choose the data range from A1 to D8 to insert a PivotTable.
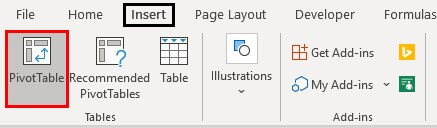
After selecting the data range to insert a PivotTable, go to the INSERT tab in Excel and click on the “PivotTable” option.
If you hate manual steps, you can press the shortcut in Excel of ALT + N + V. Upon pressing the above shortcut key; it will open up below the “Create PivotTable” window for us.
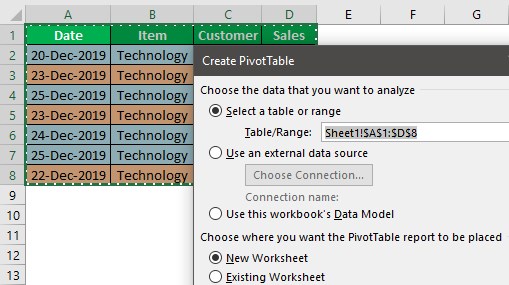
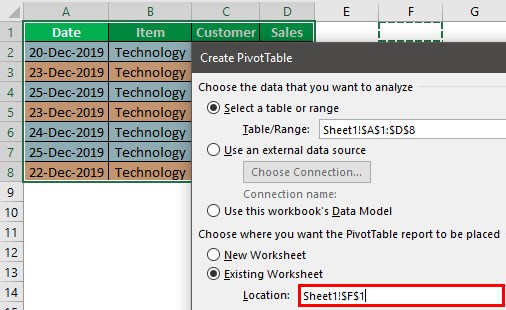
In the above window, choose the PivotTable destination as “Existing Worksheet.”

After choosing the worksheet as this Existing Worksheet, we need to select the cell address where we need to insert the PivotTable.
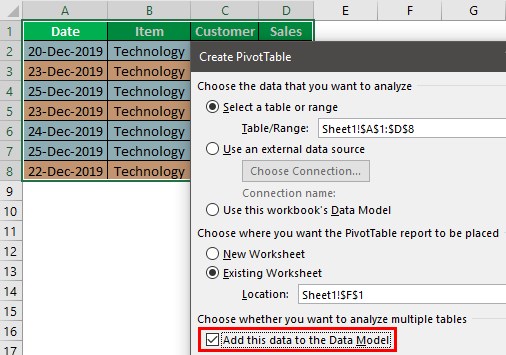
Another important thing we need to do in the above window is that the “Add this data to the Data Model” checkbox is ticked.
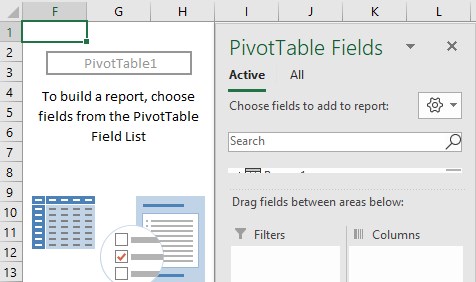
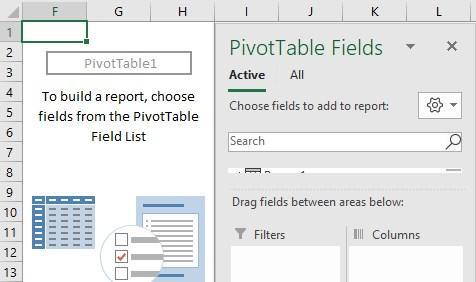
Click on “OK,” and we will have a blank PivotTable.
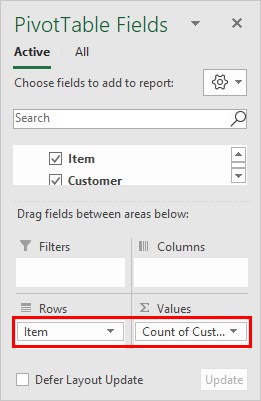
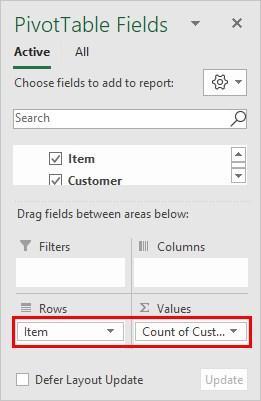
Insert the “Item” field to the “ROWS” area and the “Customer” field to the “VALUES” area.
We are getting the same total as the previous one, but we need to change the calculation type from “COUNT” to “DISTINCT COUNT.”
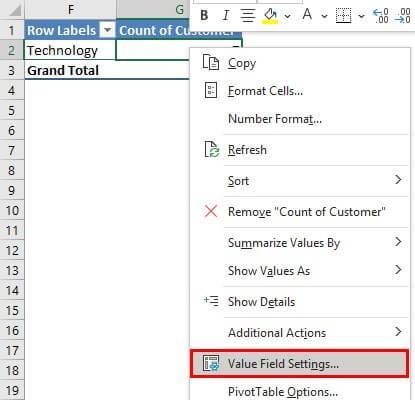
Right-click on the customer count cell and choose “Value Field Setting.”
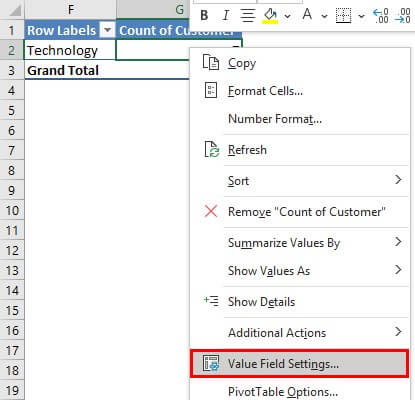
It will open up the below window for us. In this, we can see what the current summarization type is.

As we can see above, the current summarization type is “COUNT.” Hence, the PivotTable shows the current count of customers as 7 because there are 7 line items in the selected data range of the PivotTable.
The default summarization will be chosen in the case of “TEXT” values used in the “VALUES” area of the PivotTable.
In the above window, scroll down to the bottom and choose the summarization type as “DISTINCT COUNT.”

After selecting the summarization type as “DISTINCT COUNT,” click on “OK.” We will have a unique count of customers as 2 instead of 7.
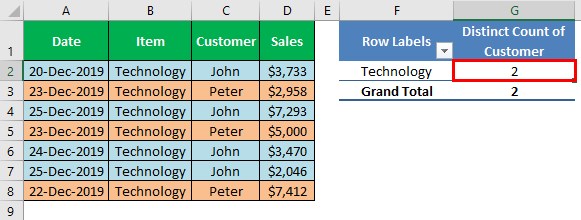
So, we have an accurate count of customers in place. We can see the column header as “Distinct Count of Customer” instead of the previous header of “Count of Customer.”
Like this, we can get the unique count of values using PivotTable’s “Distinct Count” summarization type.
Example #3
We can easily find the PivotTable count unique with simple steps.
First, choose the data range from to insert a PivotTable.
After selecting the data range to insert a PivotTable, go to the INSERT tab in Excel and click on the “PivotTable” option.
In the window, choose the PivotTable destination as “Existing Worksheet and then, select the cell address where we need to insert the PivotTable.
Next, click the “Add this data to the Data Model” checkbox is ticked.
Click on “OK,” and we will have a blank PivotTable.
Insert the “Item” field to the “ROWS” area and the “Customer” field to the “VALUES” area.
We will get the same total as the previous one, but we need to change the calculation type from “COUNT” to “DISTINCT COUNT.”
Right-click on the customer count cell and choose “Value Field Setting.”
It will open up the window with current summarization type.
With various summarization values, we can find required unique values.
Likewise, we can use PivotTable Count Unique.
Important Things To Note
- We must check the “Add this data to the Data Model” box while inserting a PivotTable.
- The “DISTINCT COUNT” summarization type is available from Excel 2013 onwards only.
Frequently Asked Questions (FAQs)
How do I count unique dates in Excel?
To change the count of date, right-click on it, select ‘Value Field Settings,’ and then scroll down the list of functions to the bottom and select ‘Distinct Count.’
Is there an Excel formula to count unique values?
To count unique text values in Excel, use the COUNTIF function with unique text criteria, the Advanced Filter feature, or the PivotTable feature, which both filter for unique text values.
Can you count unique values in Google Sheets?
Google Sheets’ COUNTUNIQUE function efficiently counts unique values in a dataset, saving time when working with large datasets. To create a pivot table, first add the Values field and then add the ‘Item field’ to the ‘Values’ to display the number of items in each Warehouse, and change the ‘Summarize’ by drop-down to COUNTUNIQUE.
How do I automatically count unique values in Excel?
To extract unique values from a column of data, one must follow the following procedure:
- Use the ‘Advanced Filter’ dialog box and paste them to a new location. The ROWS function can be used to count the number of items in the new range.
- Select the range of cells or ensure the active cell is in a table with a column heading.
- Click ‘Advanced’ in the ‘Sort & Filter’ group on the ‘Data’ tab.
- Click ‘Copy to another location,’ enter a cell reference, or click ‘Collapse Dialog Button’ image to hide the dialog box temporarily.
- Select the ‘Unique records only’ checkbox and click ‘OK.’
Recommended Articles
This article is a guide to PivotTable Count Unique. Here, we discuss how to count unique values in an Excel PivotTable with some examples. You may learn more about Excel from the following articles: –