Master Ratio Analysis Like A Pro — Download The Free Excel Template!

Table Of Contents
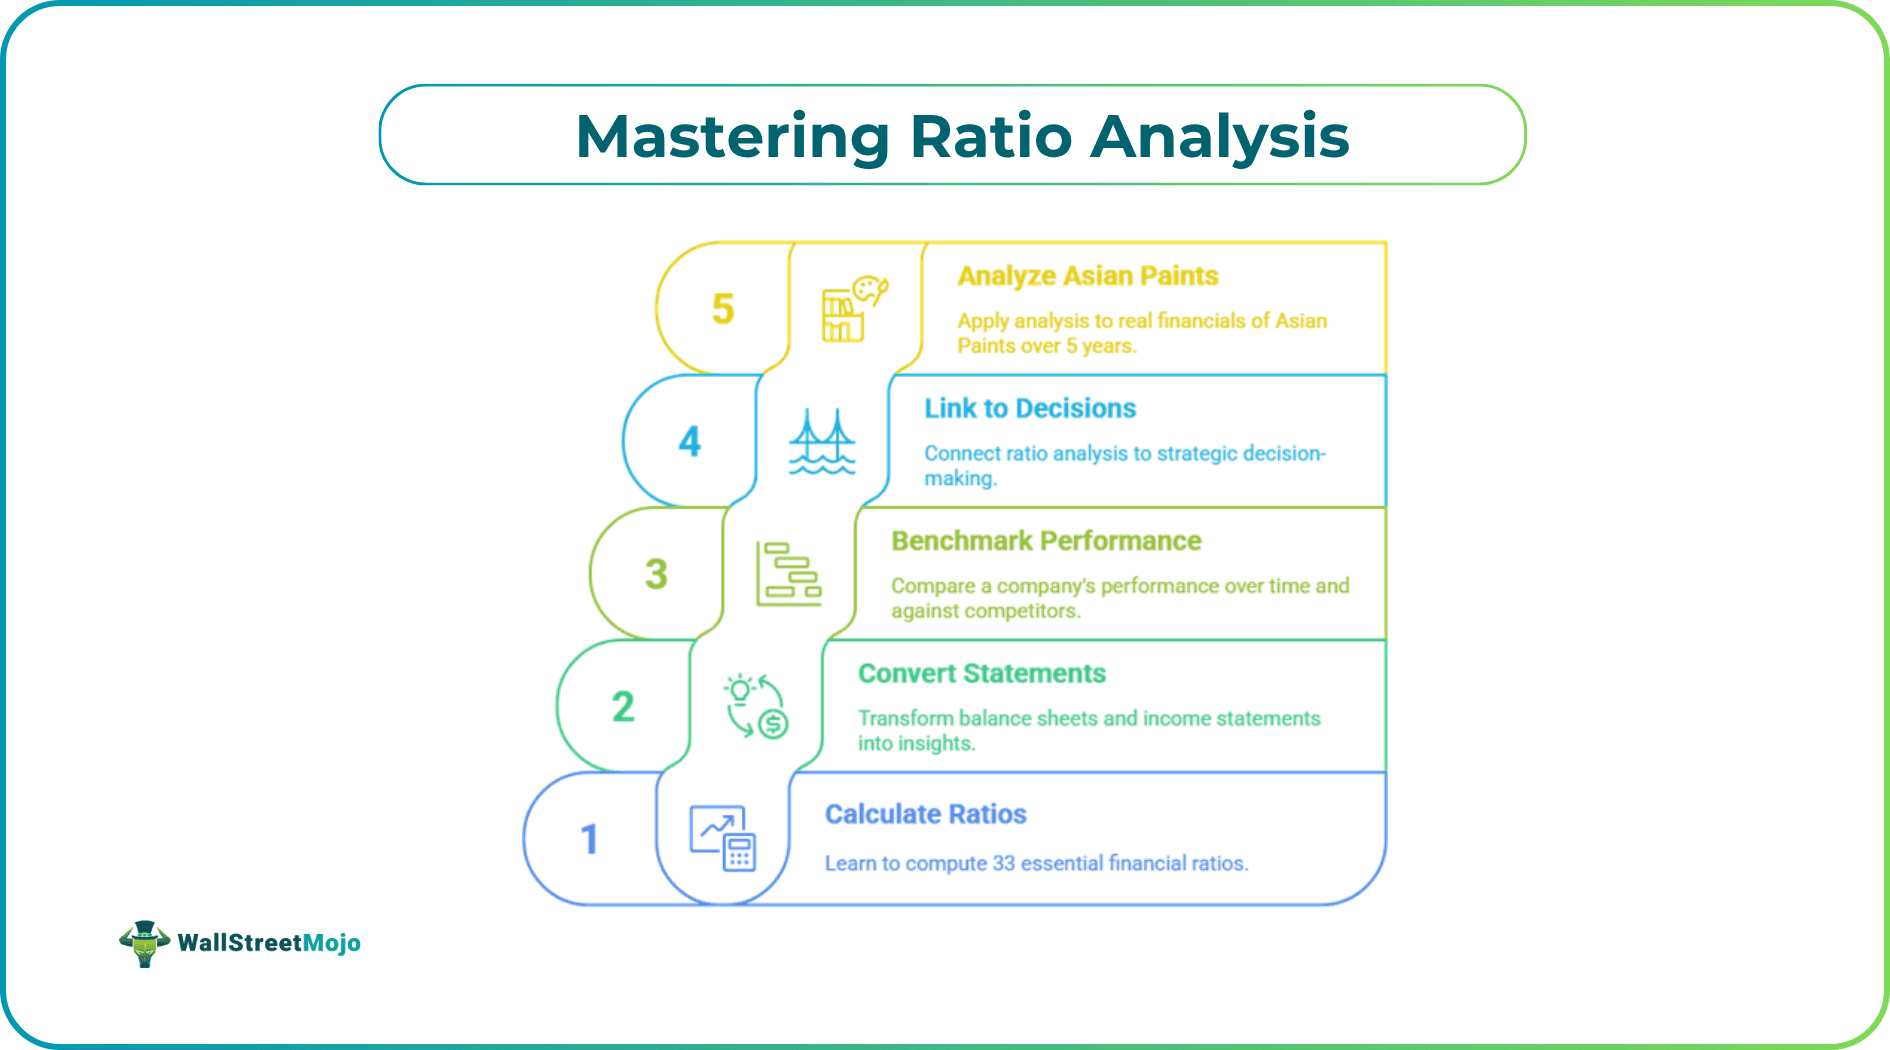
Learn To Analyze Any Company With 33 Powerful Financial Ratios (Using Asian Paints As A Real Case Study)
Are you a finance student, aspiring analyst, or an investor trying to decode the financial health of companies with confidence? If yes, we have just the right tool to accelerate your learning.
Our free Ratio Analysis Excel Template is designed using Asian Paints’ actual financials, lets you calculate and interpret key financial ratios just like professionals in investment banking and equity research.
Whether you are preparing for finance interviews, managing personal investments, or working in a corporate finance role — this practical template helps you master financial statement analysis using real-world data.
What You’ll Learn With This Template
- Calculate 33 essential financial ratios with ease
- Convert balance sheets and income statements into actionable insights
- Benchmark a company’s performance across years and against peers
- Link ratio analysis to real strategic decisions
- Analyze real financials from Asian Paints (last 5 years)
What’s Included In This Excel Template?
This Excel template is fully pre-formatted and formula-linked. Here’s what’s inside:
- Common Size Financial Statements (Vertical Analysis)
- 5-Year Trend Analysis (Horizontal + Year-over-Year)
- Auto-calculated Ratio Sheets with pre-linked formulas
- Color-coded outputs for easy interpretation
- Editable for any listed Indian company — just plug in the data
Ratio Analysis Framework: 7 Modules Covering 33 Ratios
Our Ratio Analysis template and the complementary video series are structured into 7 key modules, each focused on evaluating a specific aspect of a company’s financial performance:
#1 - Company Trends
Understand how to spot long-term patterns in financial statements.
- Common Size Analysis – Analyze each line item as a % of total revenue or assets.
- Horizontal & Trend Analysis – Compare growth and changes over multiple years.
#2 - Operating Profitability
Measure how efficiently a company generates profit from its core operations.
- Gross Profit Margin – Shows how much profit is left after direct costs.
- EBITDA Margin – Evaluates operating performance before non-cash expenses.
- Net Margin – Indicates how much of revenue turns into net profit.
- Return on Assets (ROA) – Measures profit earned per rupee of total assets.
- Return on Capital Employed (ROCE) – Evaluates return on long-term capital used.
- Return on Equity (ROE) – Reveals how well equity capital is being utilized.
- Return on Owner’s Equity – Focuses on profitability from the owners’ perspective.
- DuPont ROE – Breaks down ROE into margin, efficiency, and leverage drivers.
- Dividend Payout Ratio – Percentage of earnings distributed as dividends.
- Retention Ratio – Portion of earnings retained in the business.
- Sustainable Growth Rate – Maximum growth rate without external funding.
#3 - Business Risk
Assess how a company’s earnings fluctuate due to cost structure and financial choices.
- Total Leverage – Shows combined effect of operating and financial leverage.
- Operating Leverage – Indicates sensitivity of EBIT to sales changes.
- Financial Leverage – Measures reliance on debt for financing operations.
#4 - Solvency Ratios
Evaluate the company’s ability to meet long-term debt obligations.
- Current Ratio – Compares current assets to current liabilities.
- Quick Ratio – Tests short-term liquidity excluding inventory.
- Cash Ratio – Assesses ability to pay off liabilities with cash equivalents.
#5 - Turnover Ratios
Analyze how effectively a company utilizes its working capital and assets.
- Receivables Turnover & Days Receivables – Measures how fast customers pay.
- Inventory Turnover & Days Inventory – Indicates how quickly inventory is sold.
- Accounts Payable Turnover & Days Payable – Shows how promptly the company pays suppliers.
- Cash Conversion Cycle – Calculates time taken to convert investments into cash.
#6 - Operating Efficiency
Gauge the overall productivity of assets and capital used in operations.
- Working Capital Ratio – Indicates efficiency in managing current assets and liabilities.
- Asset Turnover Ratio – Measures revenue generated per rupee of total assets.
- Net Fixed Asset Turnover – Evaluates efficiency of fixed asset usage.
- Equity Turnover – Compares sales to shareholders’ equity.
#7 - Financial Risk
Determine the company’s exposure to debt and ability to handle interest payments.
- Debt to Equity Ratio – Compares total debt with shareholders’ equity.
- Debt Ratio – Measures proportion of assets financed by debt.
- Interest Coverage Ratio – Indicates how easily interest expenses are covered.
- Debt Service Coverage Ratio (DSCR) – Assesses ability to repay total debt obligations.
Who Should Use This Template?
This template is designed for:
- CA / CFA / MBA Finance Students preparing for exams and placements
- Aspiring Analysts, Investment Bankers, FP&A Professionals
- Retail Investors analyzing stocks for long-term investments
- Startup Founders & Finance Teams evaluating company performance
- Anyone looking to make smarter decisions using financial data
Want To Learn How To Use It Step By Step?
We’ve created an in-depth 33-part Ratio Analysis video series on YouTube (in Hindi) that explains how each ratio is calculated and interpreted — using real numbers from Asian Paints.
👉 Watch the full YouTube Series here