Part of our Templates in Excel guide
How to Create Chart Templates in Excel?
A template is a sample chart with some details already mentioned. It can be reused when the same chart is required to be used again.
Step by Step with Examples
Example #1 – Create a Chart Template using Pie Chart
Follow the below steps.
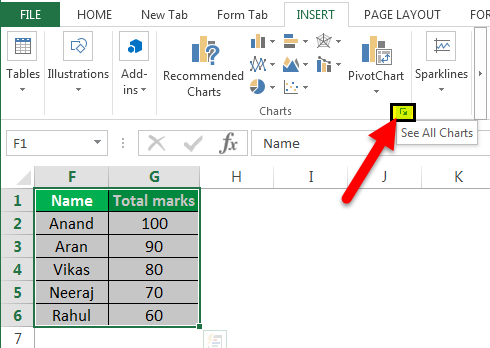
- We must consider the following data we have below:

- Select the data we want to insert in the chart, click on Charts in the Insert tab under the Charts group andselect Pie Chart in Excel.

- In the Pie Chart, we must select a -D Pie chart.

- Now, the chart for the above data is created.

- We can customize the chart by adding “Data Labels” from the “+” option provided.

- And we can stretch the chart.

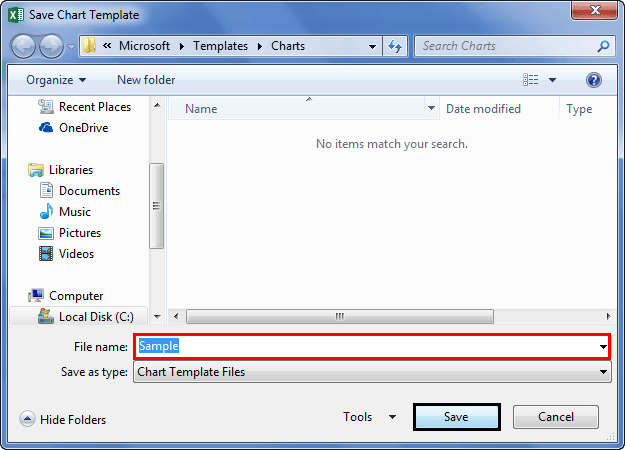
- Right-click on the chart and a wizard box appears. Next, we must click on Save as Template.

- As a result, it will ask for a chart name to be saved in the charts template. Name the chart and save it. We have named the chart a “Sample.”

- Now, we will consider the below data, which is different from the previous one.

- Now, we will select this data and click on all charts

- As a result, a dialog box appears.

- Now, we will click on Templates. We can see our created template, named a Sample. Then, click on OK.
- See the result.


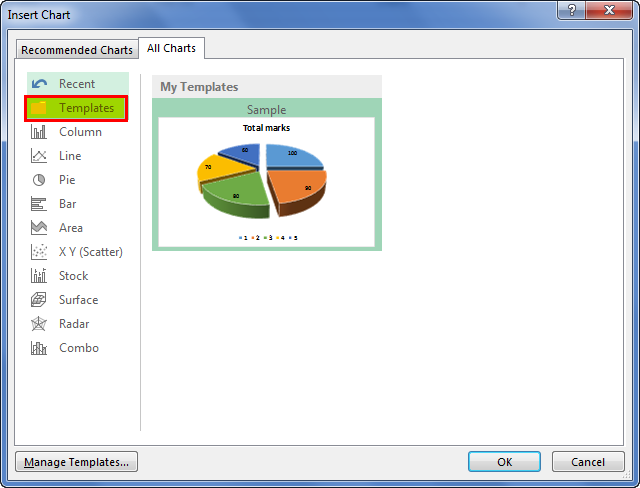

The same chart is created from the template. Therefore, we did not have to drag the whole chart and insert the data label again. That is how we use the chart templates.
Example #2 – Create a Chart Template using Pareto Chart
Earlier, we had used a pie chart, a simple chart. In the second example, we will use the Pareto chart to describe the use of creating an Excel chart template. (Pareto chart is a data analysis tool for finding the root cause).
We will have two pieces of data for Pareto, create an Excel chart template from the first data, and then use the template for the second data to make the Pareto chart.
Consider the data below,
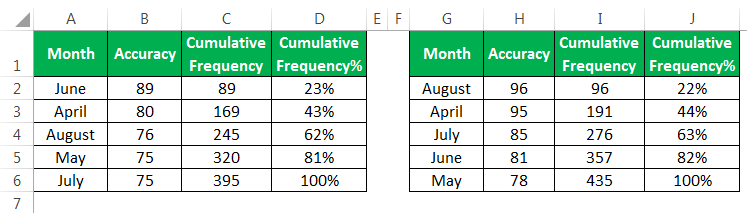
We have two sets of data for Pareto analysis. We will make the Pareto chart for the first data and save it as a template for other data.
- We must select A, C, and D columns. Then, click on “Recommended Charts” in the “Charts” section under the “Insert” tab.
- The wizard box for all charts will appear. Click on Combo charts in Excel.

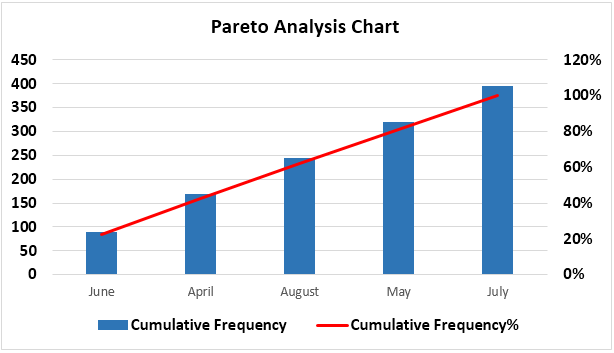
- Select “Cumulative Frequency %” as the secondary axis then click on “OK.”

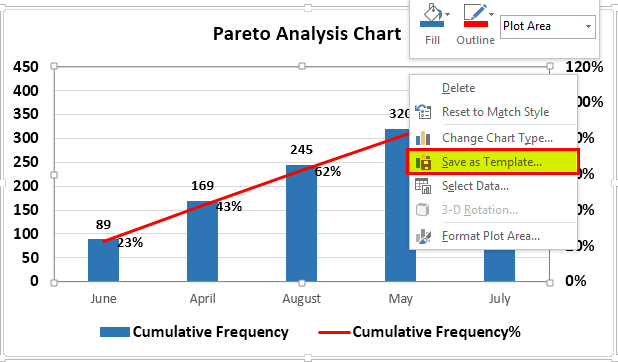
See the chart.
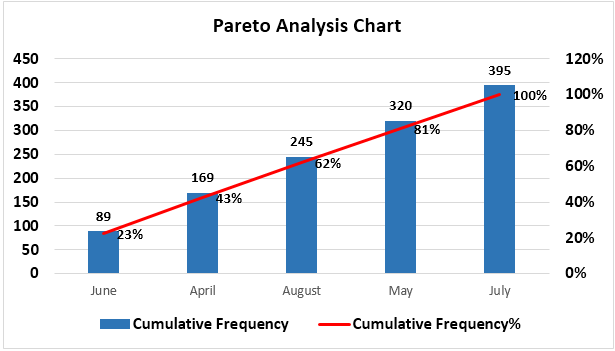
- Let us edit the chart and insert “Data Labels” from the “+” sign provided, as shown in the above example.
- Right-click on the chart and the wizard chart box to edit the chart appears. Next, click on “Save as Template.”
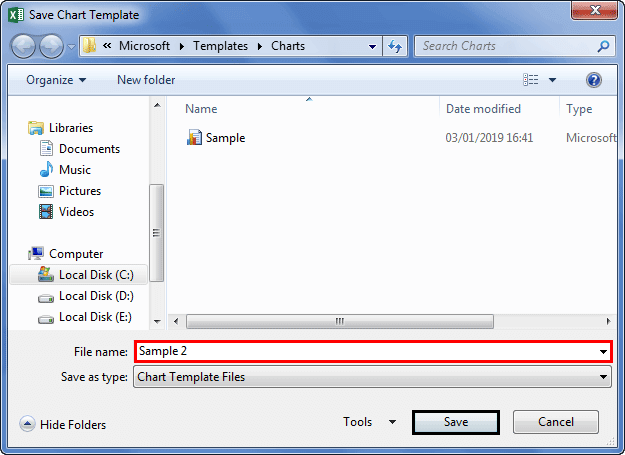
- A browse box appears. Name this template “Sample 2” and click “OK” to save it. Remember to give different names for templates, which chart needs to be reused again.
Now, we have saved our chart template for the Pareto chart.
- Select the data for the second chart, i.e., J, L, and M columns. Then, again, click on “All Charts.”

- From the “All Charts” dialog box, click on “Templates” and select “Sample 2,” the second template is created.

When we click on “OK,” we can see the Pareto chart for the second data is also created concerning the first chart.

We can see that even if we have complex charts to recreate, we can use templates to create them once and reuse them whenever required.
Things to Remember
- We need to design one chart as a sample Excel chart template.
- Always name different graph templates to know which template to use and when.
- The Excel Graph templates are saved in the system. Therefore, they will work in the same system we saved the template.
- The Excel chart template contains all the formatting done earlier. So, if we need to change the chart format, we must do it manually.
Recommended Articles
This article is a guide to Chart Templates in Excel. Here, we discuss creating graph templates in Excel with examples and downloadable Excel templates.