What Is Project Management Template In Excel?
Project Management Template, as the name suggests, helps users track and manage their projects in Excel. Also known as gantt chart, we can use this to maintain and plan the workflow and check the duration it takes to complete the project.
Project Management Excel Template
Download Excel Template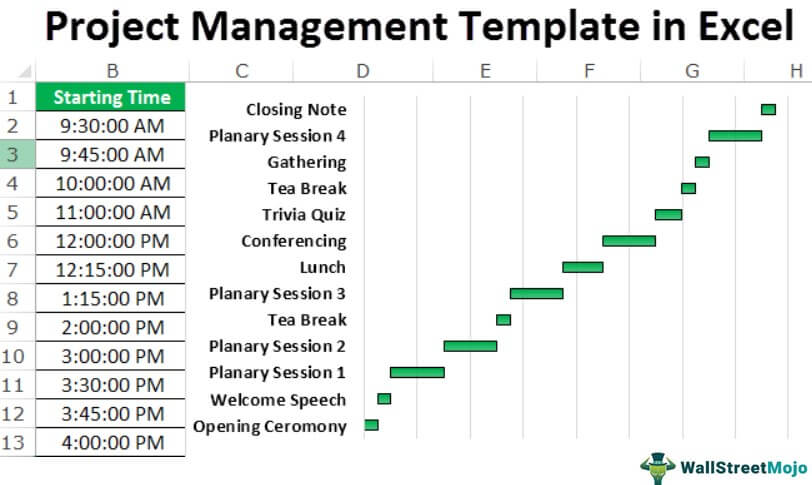
Therefore it is a great tool for managers who need to handle projects involving teams and multiple processes that not only require strict supervision but also continuous planning and identification of any negative deviations. Only then it can see the path of success within the required timeframe, effort and resource. In this article, we exclusively show you how to use Excel to prepare project management templates in Excel.
- Project Management Template in Excel is a template used to create the status of our work projects in Excel, instantly.
- Project Management in Excel is also called as Gantt chart.
- This helps us keep track of our work and helps us plan oir workflow.
- Remember, to create a project management in Excel, we have to input the start dates and the end dates.
- Excel uses this data to calculate the duration of the project, with the formula, Duration = End date – Start Date.
Project Management Template In Excel Explained
The project management templates in excel is a method of managing projects in a systemmatic manner through the use of a readymade and outlined document made in excel format that provides the manager with various criterias which are required while planning and supervising one or more projects.
Even before any project process starts, it is necessary to collect quite a number of data related to various steps and strategies to be implemented in them. Such data acts as a guide to formulate methods that will keep a tab on each action required to achieve the objective. The work of a manager is not only to manage project resources and channelise them in the right direction but also to ensure that there is no wastage or misuse in any manner.
This free project management template in excel is a planning procedure which comes with good features that help in planning in advance which is a very vital part in any such process. Since coordination and collaboration is extremely important, this tool comes quite in handy because every detail of every project resource can be recorded here. It can be customized as per the requirement of the situation and the level of work going on so that the designing of the project schedule becomes easy.
Very often, they are connected or integrated with online software that allows the manager to get updates in real-time in the system, which facilitates follow-ups and tracking systematically at every step, with an eye on the deadline. Excel also gives the facility to create charts and graphs for easy understanding and a visual representation of the workload pending as well as already managed. This helps in identifying areas that require more strict supervision.
Let us study about the tool in details in this article.
How To Create?
Creating a free project management template in excel for the purpose of project planning is not a very difficult task. It is just that the manager needs to be clear about the process and the objectives and should have ability to lead all resources in the right direction. In other words, this template will facilitate handling questions like what, who, when and why.
Excel offer a huge variety of features that can be used to create a process plan for any type of work. So, the manager should first make an outline of the different tasks to be performed. Then analyse who are the ones who will be efficient enough to handle those tasks with responsibility and commitment and identify them with each of those tasks. This has to be recorded in the template.
Then comes each task details, where the manager should explain clearly what every person has to do so that the process works in a co-ordinated manner. There should be no overlapping or miscommunication, which may result in delay and wastage. The template can be used to create multiple columns and rows with a break-up of every detail.
Next, the manager must be able to provide all the necessary things that the team member may require, which should be recorded in the template so that it is possible to identify any misuse or overuse.
Since the project management excel sheet template can be customized with time and deadline, the members should update every work with their start and end time as well as break time, which will facilitate identification of any time lag, delay, or even overtime work done.
Apart from the above, it is to be noted that all project plans offer more or less similar types of information, some of which are the project objective, responsibilities, executive summary, resource allocation, risk analysis, the target audience, cost break-up and the budget allocated to meet that, plans designed to meet unforseen contingencies, method of communication and performance evaluation.
Examples
Let us understand the concept of project management excel sheet template with the help of some suitable examples as given below:
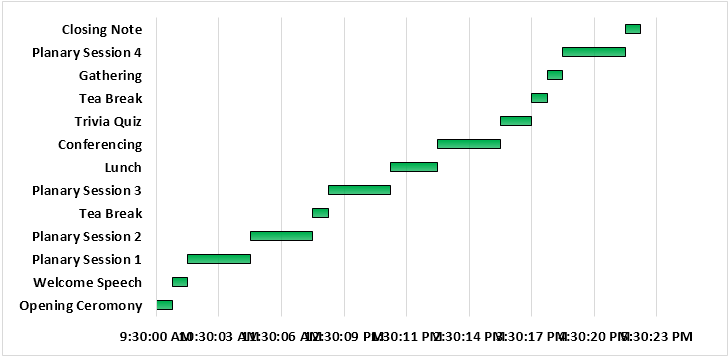
Example #1 – Excel Project Management Template By Using Gantt Chart
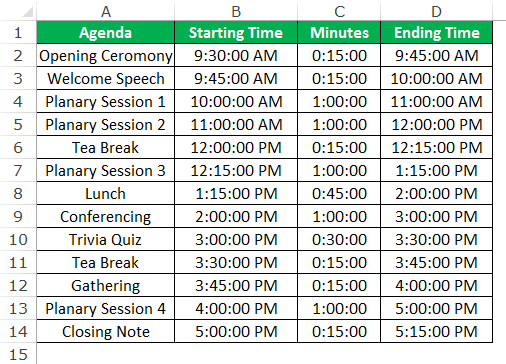
Assume you are an event management company and have taken on a very important, lucrative project. But the only thing is you need to execute the tasks based on the plan the organizers gave. For example, consider below the plan provided by the organizers.
Now, let uscreate an Excel Gantt Chartto track all the activities.
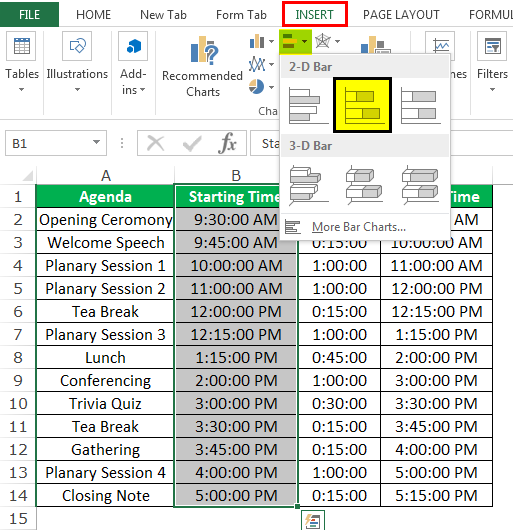
- To start with, select only start time and insert a column bar chart. Next, go to the “INSERT” tab and insert the “Stacked” bar chart.

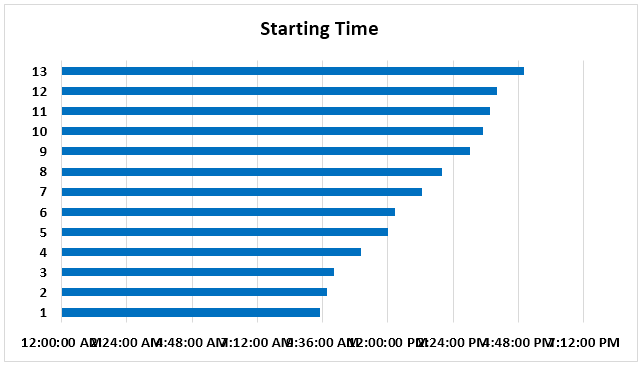
- Now, the chart may look like this.

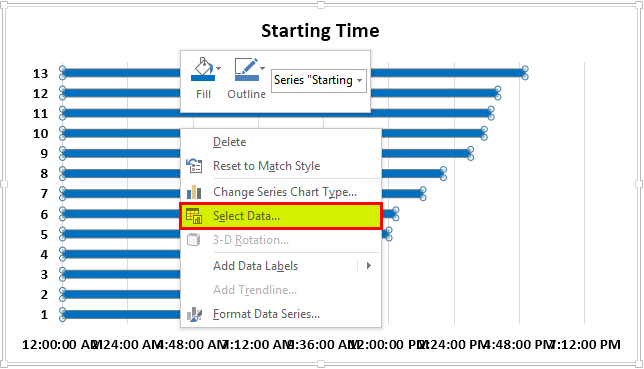
- Next, right-click on the chart and choose “Select Data.”

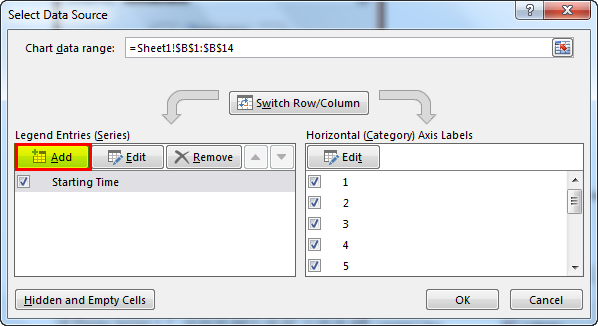
- Now, in the below window, choose “Add.”

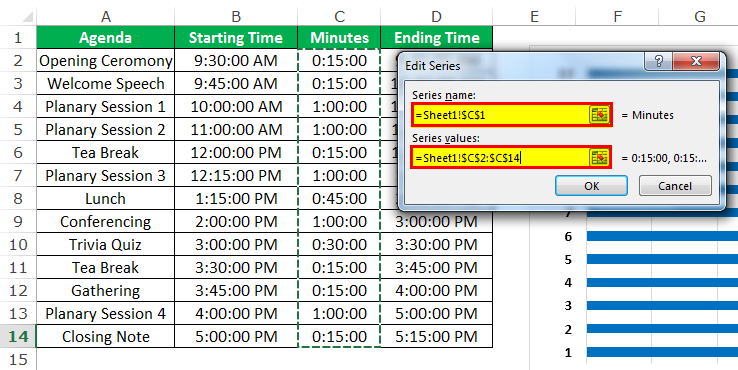
- Now, in the below window, in the “Series name,” choose “Minutes.” Then, for “Series values,” select data from C2: C14. Finally, click on “OK.”

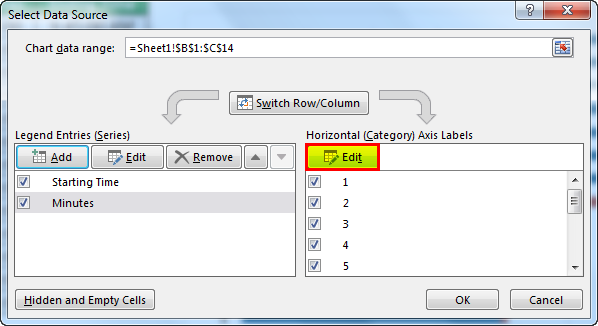
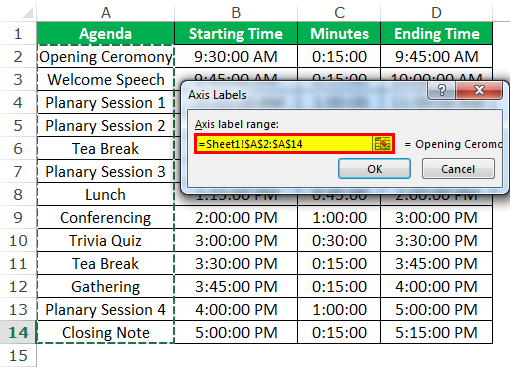
- Next, in the below window, select the “Edit” option on the left-hand side of “Horizontal (Category) Axis Labels.”
- Now, select horizontal values as our tasks. Finally, click on “OK.”

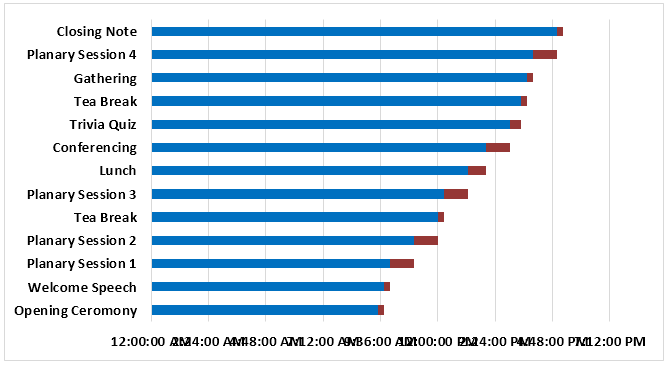
- The chart may look like this now.

- Now, we need to make some formatting to make it look better. So, we must select the horizon series values, which is the time value. Then, right-click and choose “Format Axis.”

- In the axis, formatting applies below values.

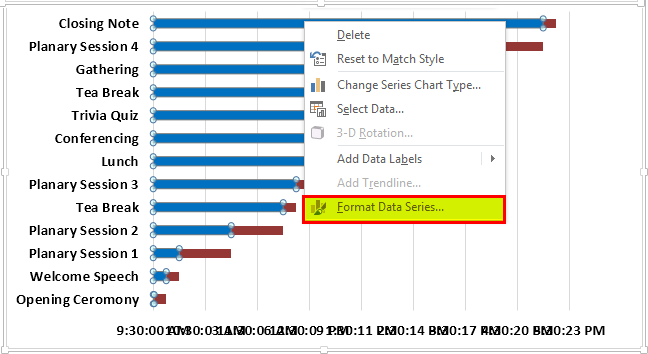
- Now, the time format will look like this in the chart.

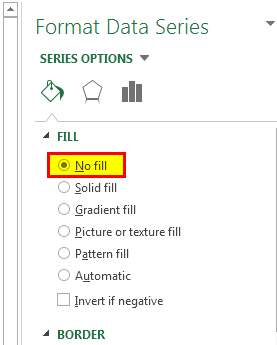
- Next, select blue colored bars, right-click, and choose “Format Data Series.”

- Then, go to the “Fill” option and select “No Fill.”

- Now, on coffee-colored bars, click “Format Data Series,” go to the “Fill” option and choose the different colors per wish.
And the chart is ready to take over the task. So, you can manage the project better now.


Example #2 – Sales Cycle Tracker Example
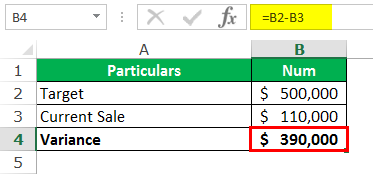
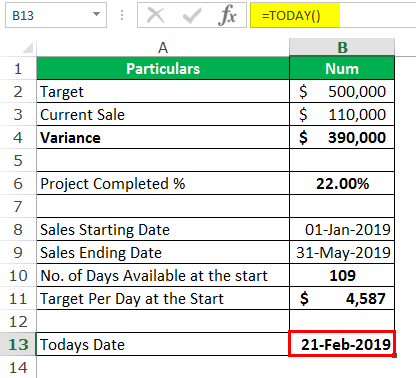
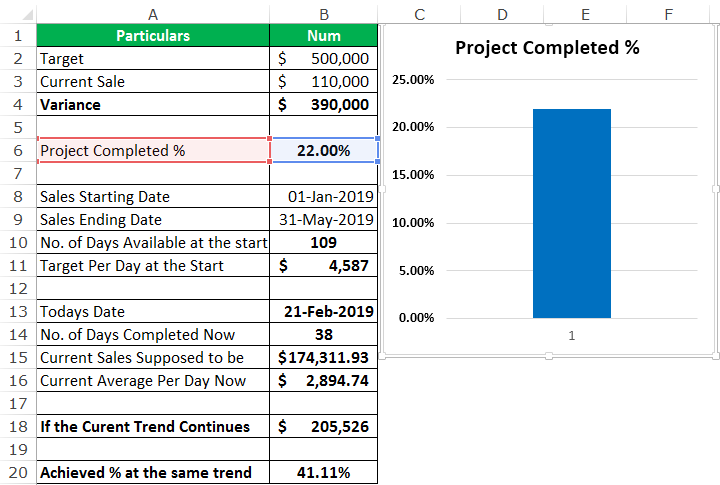
Now, we will see how to create a sales cycle tracker with Excel. Consider the below data for this example. The data includes “Sales Starting Date,” ” Sales Ending Date,” “Target,” “No. of Days Available at the start,” “Current Sale,” “Variance,” and many other things.
Step 1: First, mention “Target” and “Current Sales.” Arrive at the variance value, “Target” vs. “Current Sale.”
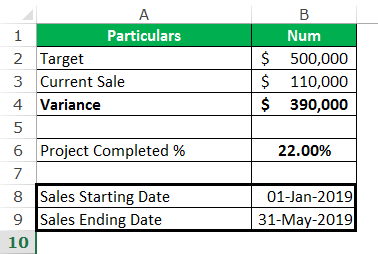
Step 2: Now, arrive at “Project Completion %.”

Step 3: Then, mention the “Sales Starting Date” and “Sales Ending Date.”
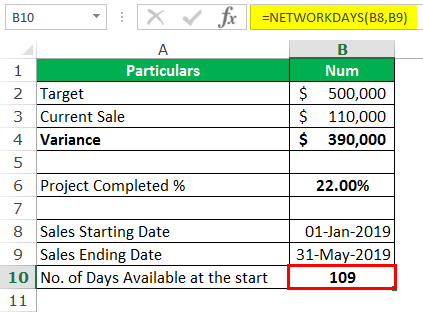
Step 4: After this, arrives at net work days between a start and end date.
Step 5: Now, we will get the “Target Per Day at the Start” by dividing the “Target” with the “No. of Days Available at the start.”

Step 6: Now, arrive at the current date by applying the TODAY formula in Excel.
.
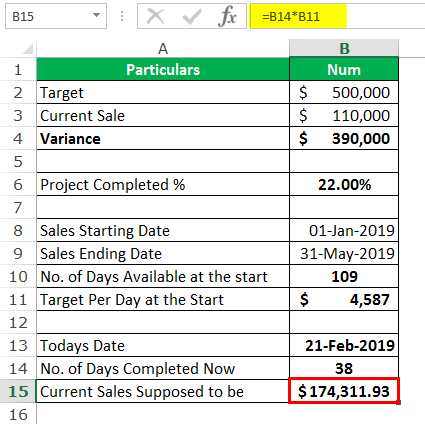
Step 7: Next, calculate the number of days completed from the start date to the current date.

Step 8: Arrive as per the daily target; what should be the current revenue.
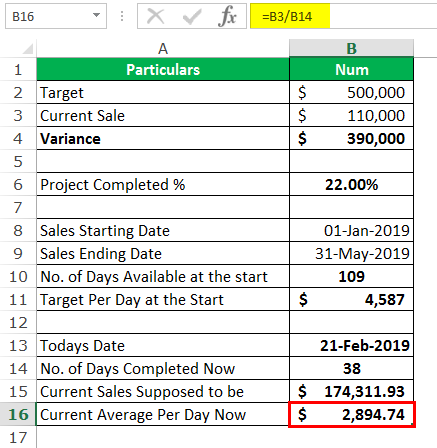
Step 9: Calculate the “Current Average Per Day Now.”
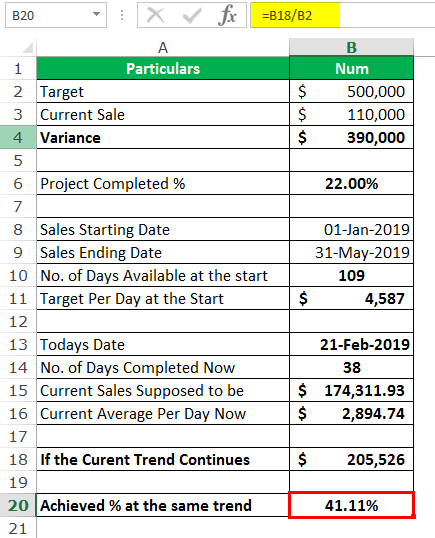
Step 10: Calculate if the average trend sales continue for the rest of the project, what would be the end revenue.

Step 11: We arrived at “Achieved % at the same trend” and “If the same trend continues.”
Now, we have completed our calculation part. Using this, let us create some visual excel charts which can help us track the project by just looking at the chart.
Steps To Create Visual Excel Charts
Step 1: Let us create a simple column chart first. Select cell B6 and create a column chart.
Step 2: Right-click on the chart and choose “Select Data.”

Step 3: Now, click on “Add.”
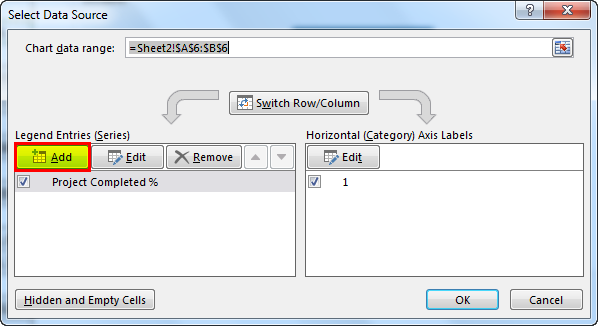
Step 4: Now, in the below window, do not select anything. Press the “OK” button.
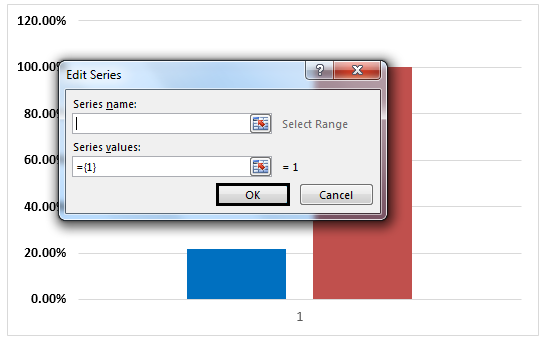
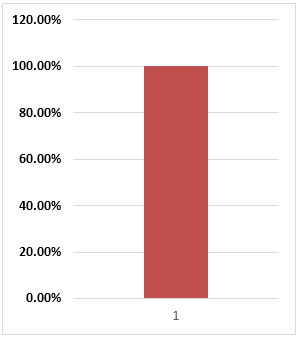
Step 5: We have a chart like this now.
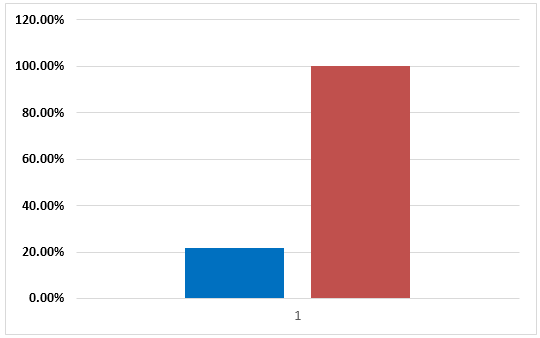
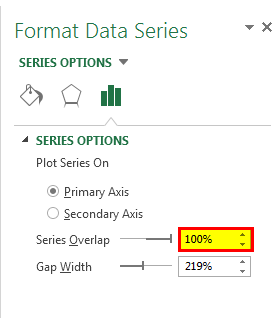
Step 6: Select the bar and click “Format Data Series.” As a result, you may see the “Format Data Series” dialog box on the right-hand side.

Step 7: Make the “Series Overlap” 100%.
Step 8: Both the columns are overlapped. The chart may look like this.
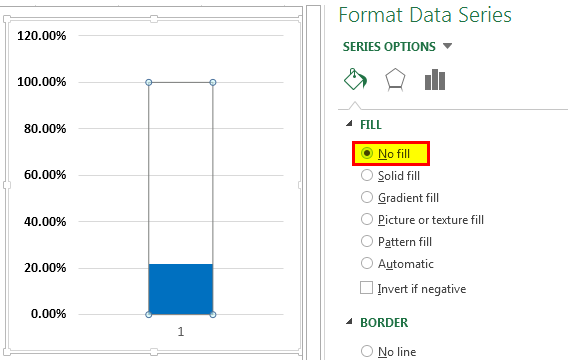
Step 9: Now, change the color of the red bar to “No Fill.”
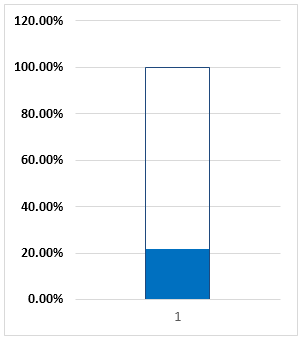
Step 10: It looks like this.
Step 11: Draw a round shape below the chart and adjust it.
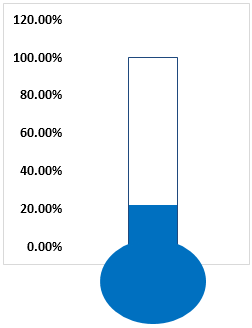
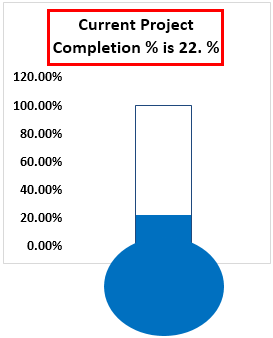
Step 12: Add chart title.
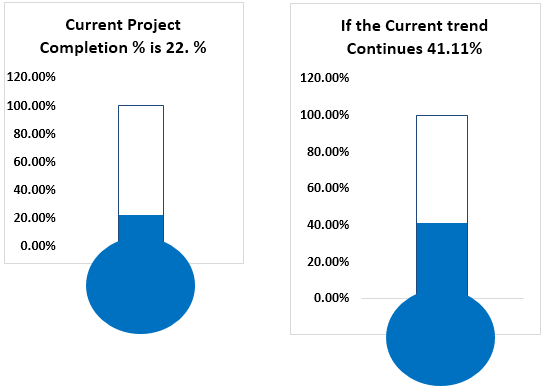
We have one chart ready. Similarly, create the second chart for “Achieved % at the same trend.”
We have two charts that look like this now.
You need to update your daily sales numbers in cell B3. After that, everything will change automatically for you.
If you observe the template now, as of 14th Feb 2019, a total of 33 days are completed, and the current should have been $1.51, but the actual revenue now is $1.1, 22% of the overall revenue.
Target per day, in the beginning, was $4587 (B11 cell). But today, the achievement is $2894.74 per day (B16 cell).
If the same trend of $2894.74 per day continues for the rest of the period of the project, it will yield you $2.53, which is 50.67% of the targeted revenue at the start.
How To Use?
The templates in excel are quite ready to use and handly especially if they are integrated with some online software. Apart from getting real-time updates, the cells can be color-coded to detect important parts and information easily. There is also the drag-and-drop facility that saves time and also creates room for extra information, if required.
The timeline templates help to schedule work and project steps and per requirement levels. Since budgeting is another important part, it is important to track cost and any deviations related to the same, which can be done using this template.
The manager should strictly instruct all team members to update daily or hourly details so that real-time updates can be received.
Below are examples of preparing project management templates in Excel.
You can download this Project Management Excel template here – Project Management Excel Template.
Project management template can help users track the duration of their projects and workflow. The most commonly used project template chart type is 2d bar chart type.However, we can use any kind of chart based on our needs.
Frequently Asked Questions
1. What is Project Management Template in Excel?
Project management is one of the important roles in any organization. However, we cannot simply track all the activities in the project just by hand. We need some software to help us in managing the project better.
MS Excel is software that can help us track the project’s status with easy templates in place.
2. What are the essentials to create project management in excel?
We know that project management in excel shows the status of the projects. So, to keep track, project management data must have the start and end dates to calculate the duration.
We can also use the formula, Duration = End Date – Start Date
3. Explain some important points to remember while working with project management in Excel.
• Charts may automatically charge if we change the manual entry columns.
• We can create a Gantt chart for activities where tasks are followed one after the other.
• In the case of different project management templates, we need to identify the tasks and line of activities involved in the project.
Recommended Articles
This article is a guide to what is Project Management Templates In Excel. We explain it with examples, how to create and how to use it. You may learn more about Excel from the following articles: –