Table Of Contents
Cohort Analysis Meaning
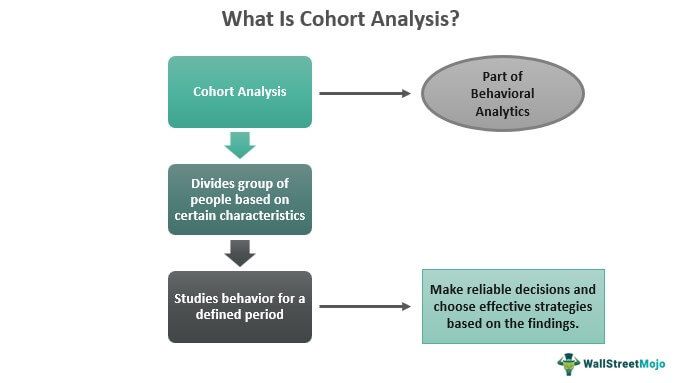
Cohort analysis refers to the assessment of data divided into groups based on certain characteristics for a defined period. Here, users do not consider and use the data set as a single unit. Instead, the set is segmented into various groups sharing the same criterion. The groups formed are known as cohorts, which are studied to find individual interests based on their characteristics.

The users collect data from different websites dealing in varied services, and divide the individuals based on a common trait they exhibit. This analysis enables users and businesses to assess the interests of people with similar traits and accordingly introduce their products and services in the market found suitable.
Key Takeaways
- Cohort analysis is the process of classifying data into different groups called cohorts. The groups have common traits and are defined by a fixed period.
- It is an important marketing tool that is used for targeting customers in a better way.
- Most analysts possess some form of bias or prejudice. The study may lose objectivity if it falls prey to the prejudices of the analysts.
- The analysis can be behavioral or of acquisition form, with the cohorts being divided into time-based, size-based, and segment-based.
Cohort Analysis Explained
Cohort analysis is part of behavioral analytics that helps businesses assess consumer behavior based on a few common criteria and accordingly decide and introduce their products and services in the market. The groups are related, have a defined time frame, and they share a common statistical trait.
If the cohort analysis is not performed, it might not let the business people understand consumer behavior. Hence, it would be difficult to learn whether their products and services would do well in the target market. The analysis, on the other hand, would give them an idea about the consumer base, helping them determine the most suitable market for the product launch.
Cohort analysis gives its users accuracy and effectiveness when segregating large data sets. However, as the data come in varying degrees, it makes it difficult to classify them properly. This analysis, however, becomes a tool to address this problem.
The purpose of this tool is to help the marketing and sales teams classify large data sets into proper groups. They classify their clients based on their engagement over the years, making quick decision-making easier for them. As a result, the analysis serves to be highly useful for SaaS businesses, the gaming industry, ecommerce initiatives, etc.
Cohort analysis in Google Analytics is one of the most effective tools to help businesses monitor traffic, conversations, and key metrics. Moreover, the analysis can be conducted in beta mode, which means one could use it even if not a power user.
Types
Businesses conduct this analysis to either assess customers' behavior in a particular market or track the activities of customers as soon as they sign up or acquire their product. In both ways, it is their behavior that is monitored. Hence, the analysis could be of two forms – behavioral analysis or acquisition analysis.
However, whichever may be the reason behind the analysis, cohorts can be broadly classified into – time-based, segment-based, and size-based analyses.
- Time-based – These cohorts are identified based on the period they sign up or start using a particular product. The period may differ based on the sales cycle of a company.
- Segment-based – The cohorts are those based on the type of products customers opted for a specific service in the past. It lets businesses understand the preferences of the majority of customers and accordingly check the level of service they opt for.
- Size-based – As the name suggests, this is the type of cohort identified as per the size of the customers involved in buying the business' products and services. The sizes can vary from the customers being a start-up firm to a well-established business enterprise.
Steps
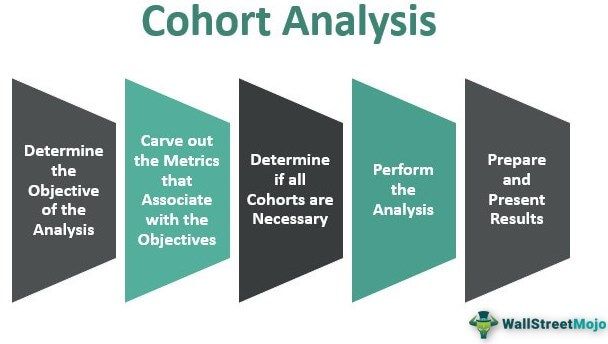
When it comes to performing a cohort analysis, here are a few steps that users or businesses must follow:

#1 - Determining the objective
Like most analyses, cohort analysis also needs to define certain objectives that it has to fulfill. Here, the examples could be finding the revenue generated by a website, or building something complex, like strategizing for improvements to the webpage traffic.
#2 - Carving out the metrics
After identifying the objectives of the analysis, the analysts must look for appropriate metrics. The data is separated using metrics that also define the features of cohorts. Some simple examples of metrics are the number of retained customers, the number of tickets sold, the per-user fee generated, etc.
#3 - Determining the necessity
If the study is about finding customer retention rates on a webpage, the analysts must appropriately determine which customer cohort would best serve the study's objective. For example, the available options could range from certain old customers, new customers, one-time customers, etc.
#4 - Conducting the analysis
After diligently carrying out the above-mentioned steps, the analysts can start their analysis. They can repeat the process with the same example. The web page owner can ascertain how the webpage has fared in different metrics over a period of time. Such metrics could include customer views, customer retention, call to action, etc.
The analysts must carefully determine the research's actionable insights from the analysis. As a result, the research will always give a true picture. The business, thus, must not hold any biases that could hinder the objectiveness of the findings.
#5 - Preparing and presenting the results
The next step is to record the results of the analysis in an appropriate format. They could be in the form of charts, tables, or summarized text. The results of the analysis must be communicated to the people likely to be influenced by the results. The cohort analysis helps in customer retention besides onboarding the new ones.
Examples
Example #1
Take the example of an e-commerce business that generates massive data on its customers. The data ranges from purchased products, customer spending, click-through rate, product ratings, product returns, and other metrics.
Cohort analysis conducted by ecommerce businesses represents the behavioral patterns in a customer's life cycle. This, in turn, helps in preparing better strategies to target suitable customers to further boost customer retention and engagement.
Example #2
Another example is when the existing users are tracked and compared across different periods. Check out this illustration through cohort analysis in Excel through the graph:

In this example, Stephens, a web page owner, wants to evaluate the traffic on his web page and the revenue it is creating. The following are some denotations:
- Series 1 – New users' revenue
- Series 2 – Old users' revenue
- Series 3 – Monthly revenue (Add series one and series 2)
In the given illustration, the webpage owner analyzes by classifying cohorts on a time basis.
He then makes the following classifications based on his analysis.
- Cohorts in the time-period August-October have amassed the highest revenue in the new-user segment (as a proportion of monthly income)
- Cohorts in the time-period January-March have the lowest revenue in the new-user segment.
- Despite higher revenue from new-user cohorts, monthly income did not rise because of low payments from old users.
This chart helps the webpage owner get useful patterns to help him improve his strategies and undertake effective business decisions.
Cohort Analysis vs Segmentation
Cohort analysis, when defined, sounds similar to segmentation. Though these terms imply dividing customers based on specific criteria, they are still different.
While segmentation deals with classifying consumer groups irrespective of time, cohort analysis deals with classifying consumers into different groups for a defined period. When both segmentation and cohort analysis are applied, businesses get an opportunity to identify friction points within a time frame, which might lead to risk aversion.
