What is the Outlier Formula?
An outlier is the data point of the given sample, observation, or distribution that shall lie outside the overall pattern. A commonly used rule says that one will consider a data point an outlier if it has more than 1.5 IQR below the first quartile or above the third quartile.
Said differently, low outliers shall lie below Q1-1.5 IQR, and high outliers shall lie Q3+1.5IQR.
One needs to calculate median, quartiles, including IQR, Q1, and Q3.
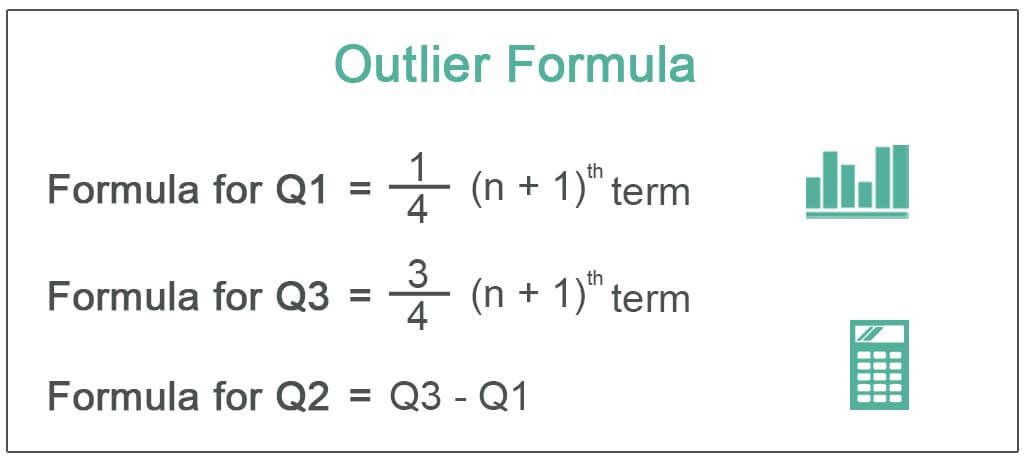
The outlier formula is represented as follows,
The Formula for Q1 = ¼ (n + 1)th term The Formula for Q3 = ¾ (n + 1)th term The Formula for Q2 = Q3 – Q1
Key Takeaways
- The outlier formula provides a graphical tool to estimate the data placed outside the given distribution set, which may be inner or outer based on the variables.
- The outliers formula is fundamental as such a value could skew data.
- Statisticians widely use the outlier formula globally while conducting any research.
Step by Step Calculation of Outlier
The below steps needs to be followed to calculate the Outlier.
- First calculate the quartiles i.e., Q1, Q2 and interquartile
- Now calculate the value Q2 * 1.5
- Now Subtract Q1 value from the value calculated in Step2
- Here Add Q3 with the value calculated in step2
- Create the range of the values calculated in Step3 and Step4
- Arrange the data in ascending order
- Check whether there any values that lie below or higher than the range created in Step5.
Example
Consider a data set of the following numbers: 10, 2, 4, 7, 8, 5, 11, 3, 12. You are required to calculate all the Outliers.
Solution:
First, we need to arrange data in ascending order to find the median.
2, 3, 4, 5, 7, 8, 10, 11, 12

Since the number of observations is odd, which is 9, the median would lie in the 5th position, which is 7, and the same will be Q2 for this example.
Therefore, the calculation of Q1 is as follows –
Q1 = ¼ (9 + 1)
= ¼ (10)
Q1 will be –
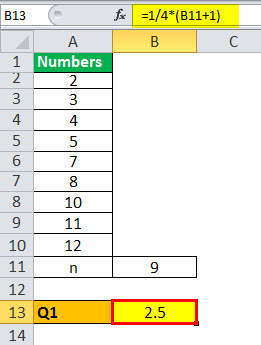
Q1 = 2.5 term
It means that Q1 is the average of the 2nd and 3rd position of the observations, which is 3 and 4 here, and an average of the same is (3+4)/2 = 3.5.
Therefore, the calculation of Q3 is as follows –

Q3 = ¾ (9 + 1)
= ¾ (10)
Q3 will be –

Q3 = 7.5 term
It means that Q3 is the average of the 7th and 8th position of the observations, which is 10 and 11 here, and an average of the same is (10+11)/2 = 10.5.
Low outliers shall lie below Q1-1.5IQR, and high outliers shall lie Q3+1.5IQR.
So, the values are 3.5 – (1.5*7) = -7 and higher range is 10.5 + (1.5*7) = 110.25.
Since no observations lie above or lower than 110.25 and -7, we don’t have any outliers in this sample.
Example of Outlier Formula in Excel (with Excel Template)
Creative coaching classes are considering rewarding students in the top 25%. However, they want to avoid any outliers. Therefore, the data is for the 25 students. Use the outlier equation to determine if there is an outlier.
Solution:
Below is given data to calculate the outlier.

The number of observations here is 25, and our first step would be converting the above raw data in ascending order.
Median will be –

The median value = ½ (n+1)
= ½ = ½ (26)
= 13th term
The Q2 or median is 68.00
Which is 50% of the population.
Q1 will be –
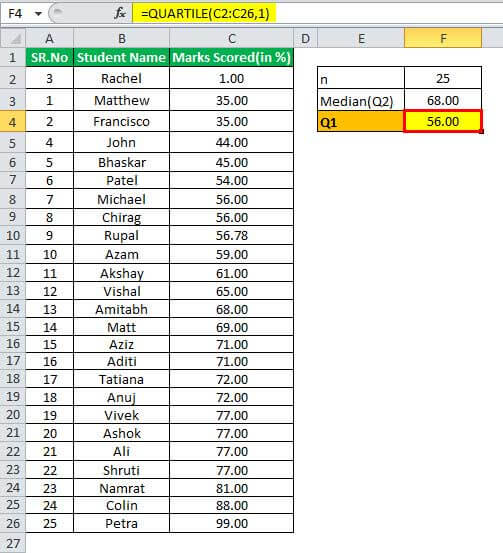
Q1 = ¼ (n+1)th term
= ¼ (25+1)
= ¼ (26)
= 6.5th term, which is equivalent to 7th term
The Q1 is 56.00, which is bottom 25%
Q3 will be –

Finally, Q3 = ¾ (n+1)th term
= ¾ (26)
= 19.50 term
Here the average needs to be taken, which is of 19th and 20th terms, which are 77 and 77, and the average of same is (77+77)/2 = 77.00
The Q3 is 77, which is the top 25%
Low Range
Now, low outliers shall lie below Q1-1.5IQR, and high outliers shall lie Q3+1.5IQR

High Range –
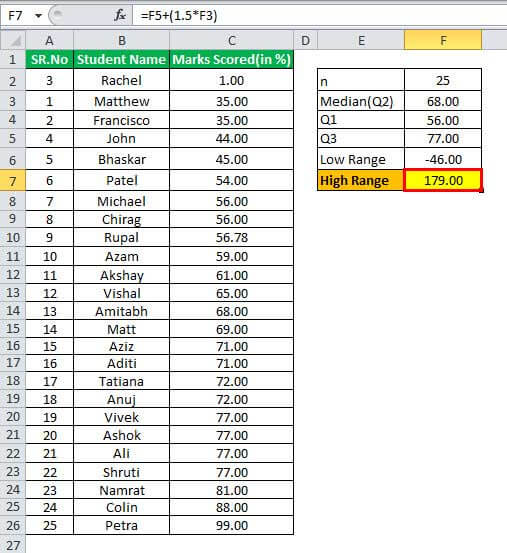
So, the values are 56 – (1.5*68) = -46 and higher range is 77 + (1.5*68) = 179.
There are no outliers.
Relevance and Uses
The outliers formula is very important to know as there could be data that would get skewed by such a value. Take an example of observations 2, 4, 6, and 101. Now, if somebody takes an average of these values, it will be 28.25, but 75% of the observations lie below 7. Hence, one would be an incorrect decision regarding the observations of this sample.
One can notice here that 101 appears to outline, and if removed, the average would be 4, which does say about the values or observations that they lie within the range of 4. Hence, it is very important to conduct this calculation to avoid misusing leading information of the data. These are widely used by statisticians around the world whenever they are conducting any research.
Frequently Asked Questions (FAQs)
Why does the outlier formula work?
Outliers provide a valuable understanding of the data one analyzes, and they can influence the statistical outcomes. Furthermore, this formula can find inconsistencies and errors in the statistical procedure. Therefore, searching outliers in a dataset helps better understand the data.
Should outliers formula be included in data?
Several outliers show natural variations in the population and are left in the dataset. These are said to be the true outliers. Other outliers are troublesome and must be discarded since they display measurement errors, data entry or processing errors, or poor sampling.
Should outliers formula be ignored?
The outliers formula boosts the variability in the data and reduces statistical power. As a result, excluding outliers make the results statistically meaningful.
When to remove outliers formula in data?
One may remove outliers only when they have a reason. Otherwise, a few outliers indicate the natural variations in the population, which must be left in the dataset. These are called true outliers.
Recommended Articles
This article is a guide to Outlier Formula. Here, we discuss a step-by-step calculation of outliers, some practical examples in Excel, and a downloadable Excel template. You can learn more about Excel modeling from the following articles: –