Positive Correlation Definition
The positive correlation is the positive relationship between two variables wherein the variables’ movements are positively linked. Therefore, if one variable goes up and the other also goes up, vice-versa.
Key Takeaways
- Positive correlation refers to a relationship between two variables where their movements are positively linked. This means that if one variable increases, the other variable also tends to increase, and vice versa.
- Positive correlations can be classified as strong (+1.0), medium (+0.5), or weak (+0.2), depending on the strength of the relationship.
- A positive correlation indicates that the variables linearly move in the same direction.
- Investors and fund managers often use positive correlation as a crucial measure to adjust a portfolio’s risk level.
Explanation
- It is the degree by which two variables act similarly. Suppose there is a positive correlation of, say 1 between two variables. Then it means that both the variables act the same way. If one goes up by 10%, the other will go up by 10%, and vice versa.
- A correlation of +0.5 means that if one variable goes up by 10%, the other variable will go up by 5%. So it gives us the degree of dependency of one variable with another. It is very important to predict the financial crisis and determine stock prices. It comes from covariance.
- Covariance gives the direction of a linear relationship between two variables. Covariance can take any positive and negative values.
- The covariance between variables X and Y is 1,000, and the covariance between variables M and K is 2,000. By seeing 1,000 and 2,000, you can say that both X-Y and M-K are positively related. If one goes up, others will also go up, but you can’t say that the relationship between M-K is doubly stronger than the one between X-Y. So, covariance only gives direction. Correlation is the standardized form of covariance, which bounds between +1 to -1. It gives both direction and strength.
Correlation = COV(X,Y) / (SDX)(SDY)
COV(X,Y) = Covariance between X and Y
- SDX = Standard Deviation of X
- SDY = Standard Deviation of Y
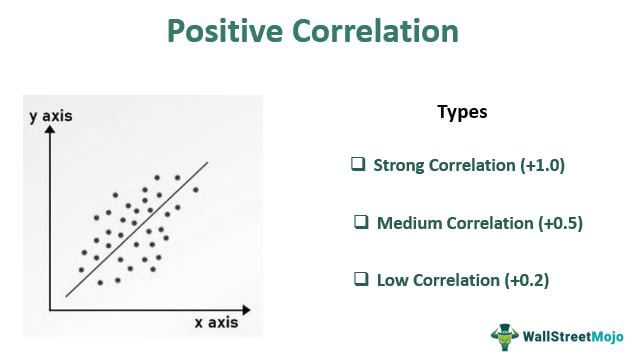
Types
There are mainly three types of positive correlations –
#1 – Strong Correlation (+1.0)
When one variable moves in one direction, other variables also move in the same direction to the same degree, which is strong. It ranges from greater than “+0.8” to “+1.0”. A correlation of +1 indicates that the variables are perfectly positively correlated. It means if one variable moves by 10%, other variables will also move by 10% in the same direction. So, it gives both strength and direction.
#2 – Medium Correlation (+0.5)
When one variable moves in one direction, other variables also move in the same direction, but their degree is not the same. For example, say one stock increases by 10%, and another stock increases by 5%, then both the stocks move in the same direction, but the magnitude is not the same.
#3- Low Correlation (+0.2)
Here, both variables move in the same direction, but the degree differs immensely. For example, if one variable gives a return of 10%, then another may give a return of 2%. So seeing this, one may predict that they will move in the same direction, but the movement is small to gain from.
Examples of Positive Correlation
Below are the examples to understand the concept in a better way –
Example #1
When the price of petrol increases, the demand for electric cars increases. So, every time a petrol price increases, it has been found that demand for electric cars has increased, say the correlation between both the products is +0.8.
Example #2
Beta in Finance. measures the correlation between stocks and markets. So, for example, if a stock has a beta of 1, then it means that if the market, on average, gives a 10% return, then the stock will also give a 10% return. So, it moves exactly like the market.
If a stock with Beta 1 is added to the portfolio replicating Stock Index, then the portfolio’s risk will remain unchanged. Adding a stock with a Beta of 0.5 will decrease the portfolio’s overall risk as the stock is less risky than the market. Similarly, a stock with a Beta of more than 1 will increase the portfolio’s overall risk.
Example #3
It empirically found that when a country’s GDP increases, the demand for luxury goods also increases. So, the demand for luxury goods and GDP have a positive correlation.
Example #4
The price of the bond positively correlates to the coupon rate. Therefore, if the Coupon Rate of a Bond is high, then its price will also be high as the bond is giving higher coupons so that the bond will be more attractive in the market, and its price will also start to rise to ignore the risk of the bond.
Example #5
As the export of a particular country increases, the demand for the home currency in the international currency market increases because people will need your home currency to make payments for the goods purchased from your country. So, the home currency starts appreciating. Therefore, it is a positive correlation between currency and exports.
Positive Correlation vs Negative Correlation
Positive correlation shows the positive linear movement of variables in the same direction. For example, if one stock increases and another increases, that is a positive correlation. A negative correlation is where both variables act in the opposite direction. If one stock increases and the other decreases, they show a negative correlation. Many commodities, stocks, and other financial instruments find positive and negative correlations.
Conclusion
A positive correlation is a very important measure that helps us to estimate the degree of the positive linear relationship between two variables. It is the most important measure that investors and fund managers use to increase or decrease risk in a portfolio. In addition, it helps us to predict many financial downturns. For example, suppose a particular market is positively related to GDP. If the GDP falls, one can predict that the market will also fall. So, tracking correlations between variables will help us understand one variable’s movement concerning another.
Frequently Asked Questions (FAQs)
What is the importance of a positive correlation?
A positive correlation is important as it indicates a relationship between two variables where their movements are positively linked. Understanding positive correlation helps in analyzing and predicting how changes in one variable may influence the other. It allows for identifying patterns, trends, and potential cause-and-effect relationships.
What are the applications of positive correlation in finance?
A positive correlation has several applications in finance. It is utilized in portfolio management to assess the relationship between different assets. By understanding positive correlations between asset returns, investors can optimize their portfolios by balancing risk and return. A positive correlation is also considered in risk management to diversify investments effectively.
What is positive correlation vs. directly proportional?
Positive correlation refers to a relationship between two variables where their movements are positively linked. It means that as one variable increases, the other variable also tends to increase. However, it does not imply a direct proportional relationship, which implies that the variables increase or decrease by the same ratio. In positive correlation, the variables may increase or decrease together but not necessarily by the same magnitude. A positive correlation indicates the direction of the relationship, while direct proportionality specifies the proportional increase or decrease in the variables.
Recommended Articles
This article is a guide to Positive Correlation and its definition. Here, we discuss positive correlation examples, their types, and differences from negative correction. You can learn more about from the following articles: –