Negative Correlation Meaning
In layperson’s terms, a negative correlation is a relationship between two variables. They are part of a function in which dependent and independent variables move in different directions regarding value. For example, if the independent variable increases, the dependent variable decreases, and vice versa.
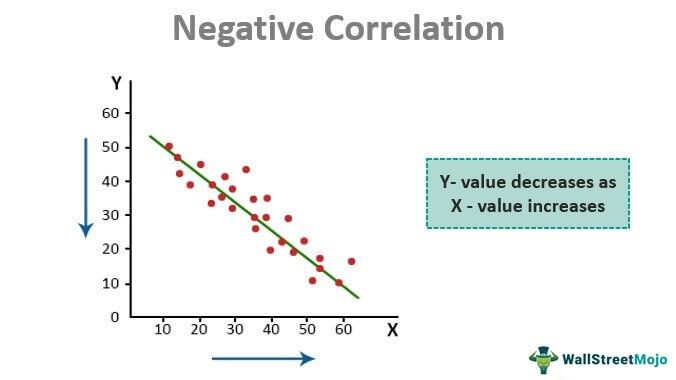
Negative correlation can be described by the correlation coefficient when the value of this correlation is between 0 and -1. The amount of a perfect negative correlation is -1. The strength of the correlation between the variables can vary. For example, suppose two variables, x and y, correlate -0.8. It means as x increases by 1 unit, y will decrease by 0.8. Now, consider that the negative correlation between these variables is -0.1. In this case, every unit change in the value of the x variable will result in a difference of 0.1 unit only in the cost of variable y.
Key Takeaways
- A negative correlation indicates that when one variable increases, the other variable tends to decrease, and vice versa, showing an inverse relationship in value.
- The correlation coefficient, which ranges from 0 to -1, measures the strength of the negative correlation. A coefficient of -1 represents a perfect negative correlation.
- Comprehending negative correlation requires a fundamental understanding of correlation as a statistical tool used to assess the extent of the relationship between two variables and their directional association.
Negative Correlation Explained
To understand the strong negative correlation better, we need to have a basic understanding of correlation. Correlation is a statistical tool that is a measure of the degree of relation between two different functions. For example, the weight and height of a person. Generally, as the height increases, the person’s value also increases. Therefore, it indicates a positive correlation between height and weight because as one variable increases, other variables also increase. But, the correlation is negative if the two variables move in opposite directions—for example, height from the seal level and temperature. As the height increases, the temperature decreases.
The formula gives correlation:
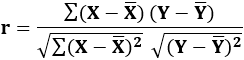
Here,
- r = correlation coefficient;
- = Mean of variable X;
- = Mean of variable Y
Rearranging gives us this formula:
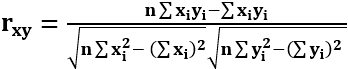
Correlation can take any value between -1 to 1. The negative sign indicates a negative correlation, while the positive sign indicates a positive correlation. Zero correlation means that there is no relationship between the two variables.
Thus, one should use the correlations only to determine a cause. The executives can use it to understand the relationship between variables, such as market demand and consumer spending, that already exists as part of the analysis. But one should not use negative correlation psychology to investigate the change in one variable due to other variables because multiple factors will always impact that relationship. For example, consumer spending in the market and the revenue of an FMCG company. They may show a positive correlation, but that company’s revenue may increase because of some other reason, like the launch of a new product or expansion into an emerging economy.
Why Negative Correlation Matters?
This concept of negative correlation psychology is widely used in the financial market for various purposes as given below.
- Portfolio Management: Correlation is widely used in the management of portfolios. Often, it is said that portfolios should be diverse. It should consist of multiple investments involving different risks and returns. If we have the same type of securities in our portfolio, any major event will impact not just one security but the whole portfolio. For that purpose, we find a correlation between the returns of securities. One should not purchase deposits with perfectly positive correlations together. Often, the stakes with negative correlations add to diversify the portfolio. Consider the above-discussed example of airline stocks and oil prices. If a portfolio has energy stocks, the management can consider buying airline stocks to hedge against the decline in oil prices.
- Economics: Many trends associated with economics involve negative correlation. This relationship between the movements can be helpful for matters relating to economic policies. For example, unemployment and consumer spending. As spending increases, unemployment decreases (generally).
How To Interpret?
Given below are some steps to identify the strong negative correlation between two variables. Let us study the same in details.
- Variable identification -The first step is to be able to identify the variable sthat we are analysing in the process. This is very important so that we can understand the relation later on.
- Coefficient calculation – Then we need to calculate the correlation coefficient for the variables, which is the value of r. There are different softwares and statistical tools to do the same. The resultant value will be between positive 1 and negative 1. If the value of r is near -1, then it shows a perfect negative correlation.
- Evaluation – The sign of the coefficient is very important for evaluation. In case the correlation is negative, the sign of r will be negative. We also need to evaluate the magnitude or the strength of the value. In case the value is very close to -1, the negative correlation is very strong.
- Understand the direction and plot data – This will further help in understanding the relationship. Since in this case, the value of one variable will move in the opposite direction of the other, the negative correlation graph will show a downward sloping line.
- Use of examples – Examples taken from real life scenarios help to understand the concept better. In this article, we have taken some useful and interesting examples that will clear our understanding. However, it is to be kept in mind that there are some other factors also which may influence the correlation.
Thus, we can see that the above steps are taken to successfully interpret the results of the calculation and the examples can be used to compare the values and identify situation where this concept is applicable.
Examples
Let us understand the concept of perfect negative correlation with the help of some suitable examples.
Example#1
- Oil prices and stocks of airline companies: Oil is a major raw material for airline companies. As the oil prices increase, their profitability starts decreasing, reflected in their stock prices. Hence, they show a negative correlation.
- Stock market and gold prices (most of the time, not always): Gold always acts as an alternative investment option for equity investors. Thus, whenever the stock market seems to be declining, investors get interested in investing in gold. Thus, gold prices start to increase.
Example#2
Suppose two stocks have provided the following returns annually in the period 2011-16:
| Year | Stock Return (%) | Year | Stock return (%) |
|---|---|---|---|
| 2011 | 43 | 2011 | 63 |
| 2012 | 21 | 2012 | 82 |
| 2013 | 25 | 2013 | 74 |
| 2014 | 42 | 2014 | 67 |
| 2015 | 57 | 2015 | 47 |
| 2016 | 59 | 2016 | 43 |
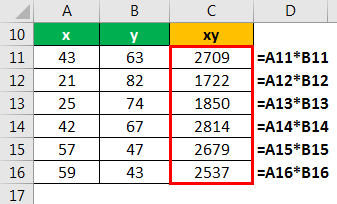
Considering the stock returns of the first stock as variable ‘x’ and that of second stock as ‘y.’
Calculation of variable xy
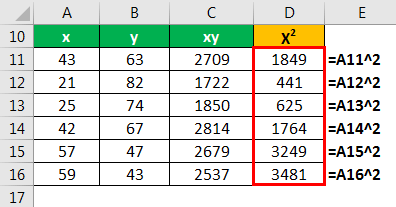
Calculation of variable X2
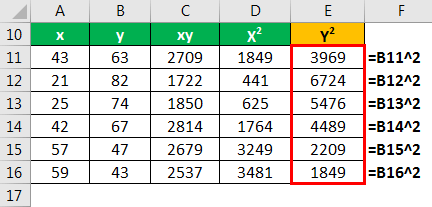
Calculation of variable Y2
Sum

Calculation of Correlation coefficient (r)

- =((6*14311)-(247*376))/(((6*11409)-(247^2))^0.5*((6*247160-(376^2))^0.5)
- =Correlation Coefficient (r) = -0.97608
Refer to the Excel sheet given above for detailed calculations.
The negative value of the correlation coefficient shows that the variables are negatively correlated.
At times, other factors may cause the variables to behave in a particular manner. In the example discussed above, one can deduce that when x increases, y decreases. But it would be wrong to suppose that the rise in ‘x’ is causing the ‘y’ to decrease because both companies may be involved in entirely different businesses and impacted by different economic conditions.
Negative Correlation Vs Positive Correlation
Both are statistical concepts that help in establishing a relation between two variables. So, we can identify how change in one variable affects another one. However, let us identify the differences between the two above concepts.
- In the former if the value of one variable increases, the other variable will decrease in value, due to which the relation in negative. But for the latter, with increase in the value of one variable, the other variable will also increase.
- If we plot a negative correlation graph of both the concepts the former will show a curve or a line that slopes downwards, whereas the latter will show a curve or a line that is upward sloping.
- The former is represented by the coefficient (r) that is less than zero, which signifies that the negative correlation will be stronger if the coefficient is closer to -1. But for the latter, the case is just the opposite, the coefficient is greater than zero. So, the closer the value of the coefficient is to 1, the stronger is the correlation.
However, it is important to note that both the concepts simply show a statistical relationship between both the variables on case of negative as well as positive correlation. There is no fixed rule that one variable will definitely cause another variable to change in value.
Frequently Asked Questions (FAQs)
What is another term for a negative correlation?
Another term for a negative correlation is an inverse correlation. It indicates that the other variable tends to decrease as one variable increases, and vice versa. The relationship between the variables moves in the opposite direction.
What is a strong negative correlation?
A strong negative correlation describes a relationship where as one variable increases, the other consistently decreases with a high degree of association. The relationship is more pronounced, showing a clear and linear inverse relationship between the variables.
What is a negative vs. positive correlation?
A negative correlation refers to a relationship where as one variable increases, the other tends to decrease. In contrast, a positive correlation describes a relationship where both variables increase or decrease together. A positive correlation indicates a direct relationship, while a negative correlation represents an inverse relationship.
Recommended Articles
This article is a guide to Negative Correlation and its meaning. We explain it with examples, differences with positive correlation & how to interpret it. You can learn more from the following statistics articles: –