What Is Pearson Correlation Coefficient?
Pearson correlation coefficient, also known as Pearson R statistical test, measures the strength between the different variables and their relationships. Therefore, whenever any statistical test is conducted between the two variables, it is always a good idea for the person analyzing to calculate the value of the correlation coefficient to know how strong the relationship between the two variables is.
Pearson’s correlation coefficient can range from the value +1 to the value -1, where +1 indicates the perfect positive relationship between the variables considered, -1 indicates the perfect negative relationship between the variables considered, and 0 value indicates that no relationship exists between the variables considered.
Key Takeaways
- Pearson correlation coefficient, also known as Pearson R, is a statistical test that estimates the strength between the different variables and their relationships.
- Hence, whenever any statistical test is performed between the two variables, it is always a good idea for the person to estimate the correlation coefficient value to know the strong relationship between them.
- The correlation coefficient of -1 means a robust negative relationship. Therefore, it imposes a perfect negative relationship between the variables.
- If the correlation coefficient is 0, it displays no relationship. Moreover, if the correlation coefficient is 1, it means a strong positive relationship. Therefore, it implies a perfect positive relationship between the variables.
- The Pearson correlation coefficient shows the relationship between the two variables calculated on the same interval or ratio scale. In addition, It estimates the relationship strength between the two continuous variables.
Pearson Correlation Coefficient Explained
The Pearson correlation coefficient represents the relationship between the two variables, measured on the same interval or ratio scale. It measures the strength of the relationship between the two continuous variables.
The coefficient not only states the presence or absence of the correlation between the two variables but also determines the exact extent to which those variables are correlated. It is independent of the unit of measurement of the variables where the values of the correlation coefficient can range from the value +1 to the value -1. However, it is insufficient to tell the difference between the dependent and independent variables.
It is independent of the unit of measurement of the variables. For example, suppose the unit of measurement of one variable is in years while the unit of measurement of the second variable is in kilograms. In that case, even then, the value of this coefficient does not change.
The correlation coefficient between the variables is symmetric, which means that the value of the correlation coefficient between Y and X or X and Y will remain the same.
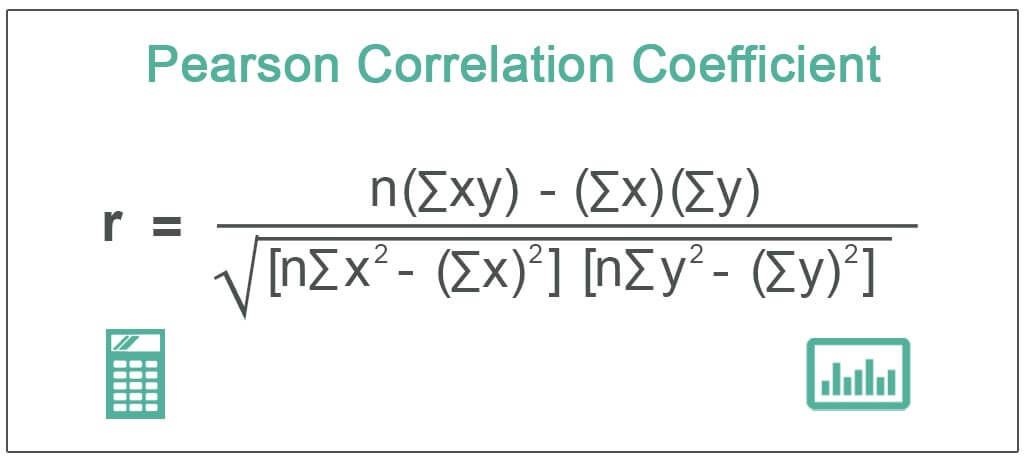
Formula
The Pearson Correlation Coefficient formula is as follows:
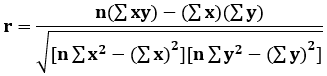
Where,
- r = Pearson Coefficient
- n= number of pairs of the stock
- ∑xy = sum of products of the paired stocks
- ∑x = sum of the x scores
- ∑y= sum of the y scores
- ∑x2 = sum of the squared x scores
- ∑y2 = sum of the squared y scores
How To Calculate?
The steps for Pearson correlation coefficient calculation are as follows:
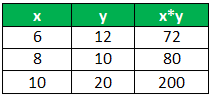
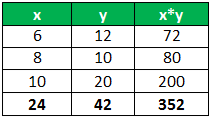
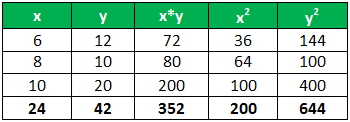
- Find out the number of pairs of variables denoted by n. Suppose x consists of 3 variables – 6, 8, 10. Suppose y consists of corresponding three variables: 12, 10, and 20.
- List down the variables in two columns.

- Find out the product of x and y in the 3rdcolumn.

- Find the sum of values of all x and y variables. Write the results at the bottom of the 1st and 2nd columns. Then, write the sum of x*y in the 3rd column.

- Find out x2and y2in the 4thand 5thcolumns and their sum at the bottom of the columns.

- Insert the values found above in the formula and solve it.
r = 3*352-24*42 / √(3*200-24^2)*(3*644-42^2)= 0.7559

Examples
Let us consider the following Pearson Correlation Coefficient examples to see how it is calculated in Excel:
Example #1
With the help of the following details in the table, the six people have different ages and weights given below for the calculation of the value of the Pearson R.
| Sr No | Age (x) | Weight (y) |
|---|---|---|
| 1 | 40 | 78 |
| 2 | 21 | 70 |
| 3 | 25 | 60 |
| 4 | 31 | 55 |
| 5 | 38 | 80 |
| 6 | 47 | 66 |
Solution:
For the Calculation of the Pearson Correlation Coefficient, we will first calculate the following values,
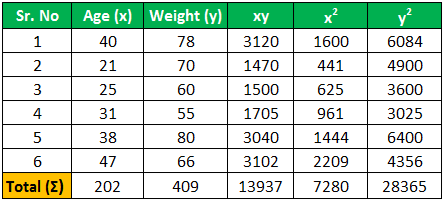
Here the total number of people is 6 so, n=6
Now the calculation of the Pearson R is as follows,
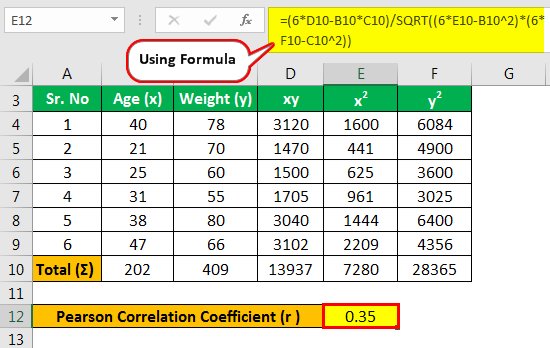
- r = (n (∑xy)- (∑x)(∑y))/(√ [n ∑x2-(∑x)2][n ∑y2– (∑y)2 )
- r = (6 * (13937)- (202)(409)) / (√ [6 *7280 -(202)2] * [6 * 28365- (409)2 )
- r = (6 * (13937)- (202) * (409))/(√ [6 *7280 -(202)2] * [6 * 28365- (409)2 )
- r = (83622- 82618)/(√ [43680 -40804] * [170190- 167281 )
- r = 1004/(√ [2876] * [2909 )
- r = 1004 / (√ 8366284)
- r = 1004 / 2892.452938
- r = 0.35
Thus the value of the Pearson correlation coefficient is 0.35
Example #2
There are 2 stocks – A and B. Their share prices on particular days are as follows:
| Stock A (x) | Stock B (y) |
|---|---|
| 45 | 9 |
| 50 | 8 |
| 53 | 8 |
| 58 | 7 |
| 60 | 5 |
Find out the Pearson correlation coefficient from the above data.
Solution:
First, we will calculate the following values.
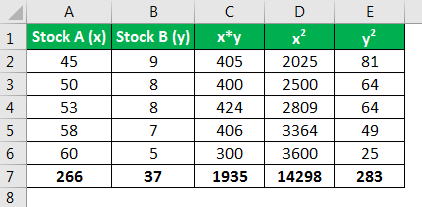
The calculation of the Pearson coefficient is as follows,
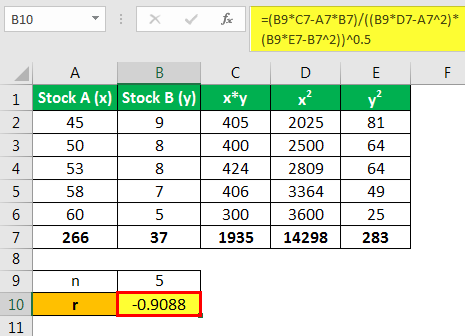
- r = (5*1935-266*37)/((5*14298-(266)^2)*(5*283-(37)^2))^0.5
- = -0.9088
Therefore the Pearson correlation coefficient between the two stocks is -0.9088.
Interpretation
The interpretation of the correlation coefficient is as under:
- If the correlation coefficient is -1, it indicates a strong negative relationship. It implies a perfect negative relationship between the variables.
- If the correlation coefficient is 0, it indicates no relationship.
- If the correlation coefficient is 1, it indicates a strong positive relationship. It implies a perfect positive relationship between the variables.
A higher absolute value of the correlation coefficient indicates a stronger relationship between variables. Thus, a correlation coefficient of 0.78 indicates a stronger positive correlation than a value of 0.36. Similarly, a correlation coefficient of -0.87 indicates a stronger negative correlation than a correlation coefficient of -0.40.
In other words, if the value is in the positive range, the relationship between variables is positively correlated, and both values decrease or increase together. On the other hand, if the value is in the negative range, it shows that the relationship between variables is negatively correlated, and both values will go in the opposite direction.
Significance
- It helps in knowing how strong the relationship between the two variables is. The presence or absence of the correlation between the two variables indicates using the Pearson correlation coefficient. It also determines the exact extent to which those variables are correlated.
- Using this method, one can ascertain the direction of correlation, i.e., whether the correlation between two variables is negative or positive.
Limitations
- The Pearson correlation coefficient R is insufficient to tell the difference between the dependent and independent variables as the correlation coefficient between the variables is symmetric. For example, if a person is trying to know the correlation between high stress and blood pressure, one might find a high value of the correlation, which shows that high stress causes blood pressure. Now, if the variable switches around, then the result, in that case, will also be the same, which shows that stress is due to blood pressure, which makes no sense. Thus, the researcher should be aware of the data he uses for the analysis.
- Using this method, one cannot get information about the slope of the line as it only states whether any relationship between the two variables exists or not.
- The Pearson correlation coefficient may likely be misinterpreted, especially in the case of homogeneous data.
- Compared with the other calculation methods, this method takes much time to arrive at the results.
Frequently Asked Questions (FAQs)
What is Karl Pearson coefficient of correlation?
Karl Pearson’s coefficient of correlation refers to a linear correlation coefficient that comes in the value range of -1 to +1. A value of -1 indicates a strong negative correlation, while +1 means a strong positive correlation.
When to use Pearson correlation coefficient?
One must use the Pearson correlation coefficient if the relationship is linear; both variables are quantitative, normally distributed, and possess no outliers.
What are the assumptions of Pearson’s correlation coefficient?
Pearson’s correlation coefficient assumes that the data must satisfy if one wants to utilize Pearson’s r. Then, both variables are on an interval or ratio measurement level. The data from both variables comply with normal distributions. In addition, the data must have no outliers.
What are the properties of Pearson correlation coefficient?
The correlation coefficient remains in the same measurement as the two variables. The sign is that coefficient correlations are always the same as the variance. Therefore, the numerical value of the coefficient correlation is between -1 and + 1.
Recommended Articles
This article is a guide to what is Pearson Correlation Coefficient. We explain the formula, interpretation, example & how to calculate along with significance. You can learn more about Excel modeling from the following articles: –