Part of our Data Analysis guide
Inverse Correlation Meaning
Inverse correlation is the mathematical relationship between two variables wherein their positions are opposite to each other. It signifies that if one variable displays an increase in its position, the other variables will display a decrease.
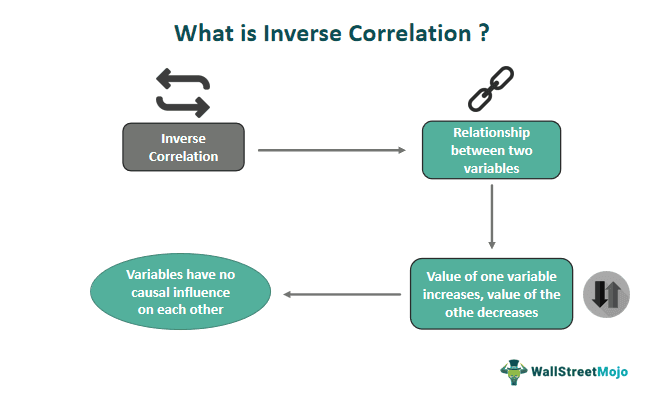
A negative correlation coefficient signifies inverse correlation, and the value presented by the correlation coefficient signifies the strength of a linear or non-linear relationship between two variables. This inversely proportional relationship between variables, however, does not imply any causal effect of one variable on another.
Key Takeaways
- Inverse correlation refers to the opposite movement of two variables. When one variable increases, the other decreases.
- Negative correlation coefficients indicate inverse correlation, with the value representing the strength of the relationship between the variables.
- Regression analysis and scatter plots are effective methods for visually demonstrating inverse correlation.
- A diversified portfolio is valuable as it decreases the unsystematic risk component, making it crucial to have assets that display inverse correlation.
- Regression analysis and scatter plots effectively illustrate the inverse correlation between two variables.
Inverse Correlation Explained
Inverse correlation, as stated above, signifies the inversely proportional relationship between two variables. This means, when the value of one variable increases, the other tends to decrease. Using this correlation technique, one can find out how two elements or variables are interrelated.
Though the name inverse correlation, which is also known as negative correlation, indicates a variable affecting the other negatively, it’s not the case. Here, the movement might reflect opposite directions, but there is no causal impact or influence of one variable on the other.
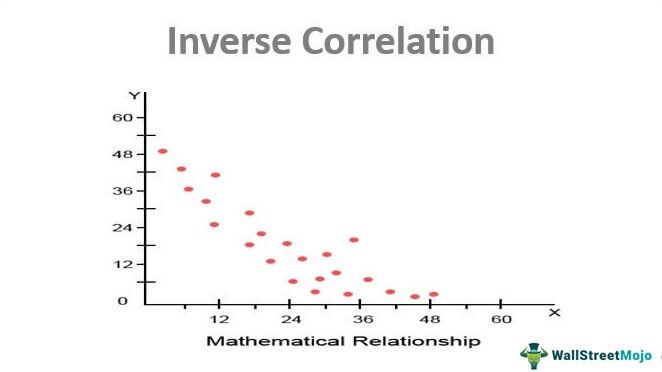
The correlation analysis depicts how two variables taken up for analysis behave with each other. If one variable appreciates its characteristics, the other variable will display deterioration in its value. The best way to determine the inverse correlation between two variables is to employ regression analysis and plot the results using a scatter plot.
The portfolio of assets that offers an inverse correlation is said to be diversified. A diversified portfolio reduces the measure of unsystematic risk.
For example, the stock market and the bonds market usually move in the opposite direction, but this opposite movement is not caused by the impact of one on the other in a negative way. Instead, it just helps users or analysts to learn the pattern, which is inversely related.
This analysis is not static but dynamic and modifies itself with time. The two variables taken up for analysis can display a positive correlation for a specific period and an inverse correlation for the next period. It does not describe the cause-and-effect relationship between the two variables. If the correlation is not calculated correctly, it can present skewed results.
How to Find?
The correlation coefficient helps determine the relationship between two variables using statistical and mathematical relationships as an inverse correlation (when the coefficient is negative).
For two variables, X and Y, one can display the correlation coefficient as below: –
r = n (∑xy) – ∑x ∑y / √ [n* (∑x2 – (∑x)2)] * [n* (∑y2 – (∑y)2)]
Here, the number of variables for determining the correlation coefficient is represented as n.
- If both variables (X and Y) share the same number of data sets employed to determine correlation, it would be termed homogenous. If both variables share a different number of data sets employed, it would be termed heterogeneous.
- Correlation calculation for the homogenous dataset is easier and less complex than with heterogeneous datasets.
Graph
Based on the above assumptions and findings, here is the graph that gets derived.
Examples
Let us consider the following examples to understand the concept better:
Example 1
Suppose an investor holds two assets X and Y have the following returns: –
- X: 22, 20, 110
- Y: 70,80,30
To calculate the correlation coefficient of X and Y, perform the following steps: –
- ∑X = 22 + 20 + 110 = 152
- ∑Y = 70 + 80 + 30 = 180
- ∑(X2)=(22)2+(20)2+(110)2= 12,984
- ∑(X×Y) = (22×70) + (20×80) + (30×110) = 6,440
- ∑(X)2 = (152)2 = 23,104
- ∑(Y)2 = (180)2 = 32,400
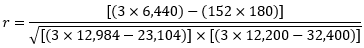
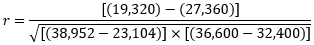
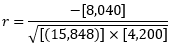

r = – 0.99
Therefore, the Investor holds a diversified portfolio of two assets. As a result, the portfolio provides an inverse correlation of -0.99.
Example 2
Gold is a commodity that is a very popular instrument that one can use both for hedging purposes as well as for investment. Gold as an asset shares an inverse correlation-based relationship with the United States dollar.
Gold can curb the rising levels of inflation and hence curb any potential loss in the value of US dollars. Whenever a dollar collapses in front of rising inflation, gold can be utilized as an alternative investment tool to curb inflation, stop the loss of value, and reduce the potential impacts of a dollar collapse.
Inverse Correlation in Portfolio Diversification
Diversification is a process that reduces concentration risk and helps allocate investment capital to more than one asset. A portfolio of assets formulates diversifying the risk inherent in holding such assets and ensuring stable returns. A portfolio signifies a collection of financial assets, such as bonds, stocks, or commodities.
The diversification achieved for a portfolio of assets is an example of an inverse correlation. Therefore, when the correlation coefficient is at -1, it is said that the diversification is at maximum, and there is a minimum risk involved in the portfolio of assets formulated.
Advantages
Studying the inverse correlation patterns has a lot of advantages, which also include the following:
- It offers diversification to the portfolio of financial assets.
- Diversifiable risk is defined as the risk that is specific to the firm.
- A portfolio holds assets that are not specific to one firm or industry but caters to multiple firms or industries.
- Each industry does not necessarily perform similarly, resulting in an inverse correlation.
- An inverse correlation between the two assets can help in the hedging positions.
Disadvantages
Besides having multiple merits of studying this pattern, there are various limitations as well, which one must know of. Some of them have been listed below:
- The analysis of the inverse correlation does not account for potential outliers.
- Additionally, the analysis does not consider the odd behavior of a few data points in the data set chosen for analysis.
- Various factors and variables might not be a part of the determination and analysis of inverse correlation.
- Extrapolating the results of reference data onto the new data can give rise to errors and high levels of risk.
- An inverse correlation between two variables does not mean a cause-and-effect relationship between the two variables.
Frequently Asked Questions (FAQs)
Are there any assumptions when interpreting inverse correlation?
When interpreting inverse correlation, it is important to assume linearity or non-linearity of the relationship, the absence of outliers or influential points, and adherence to the relevant statistical assumptions for accurate interpretation.
What are the applications of inverse correlation in finance?
In finance, inverse correlation has numerous valuable applications. One significant application is risk management, where investors utilize assets with negative correlations to offset risk exposure. By including assets that move in opposite directions, such as stocks and bonds, the overall portfolio becomes more resilient to market fluctuations. This diversification strategy aims to reduce the impact of adverse events on the portfolio’s performance and potentially improve long-term returns.
What is the difference between positive and inverse correlation?
Positive correlation refers to the scenario where two variables move in the same direction. In contrast, inverse correlation occurs when the variables move in opposite directions. Positive correlation implies a direct relationship, while inverse correlation signifies an indirect or inverse relationship between the variables.
Recommended Articles
This article has been a guide to Inverse Correlation & its Meaning. Here, we explain it along with graphs and examples, while looking at how to find it. You can learn more about it from the following articles: –