Covariance Definition
Covariance in statistics refers to the study of the relationship between the changes in two variables. Based on the nature of the relationship, it can be positive or negative. Covariance can be calculated using a mathematical formula or in excel. It is used in research, economics, and finance.
Covariance Excel Template
Download Excel Template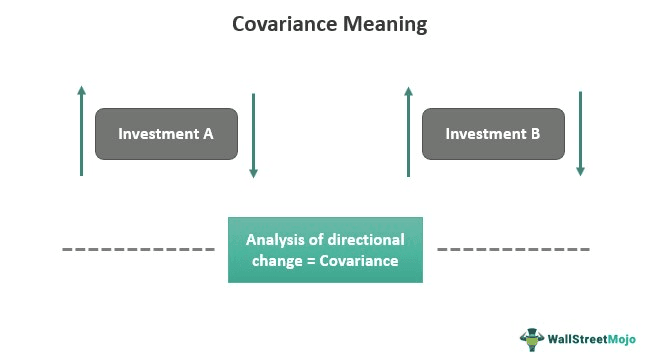
In the case of finance, the movement of two assets or investments is studied. It also helps diversify the portfolio by managing risk and volatility. The covariance applications are extensively present in portfolio theories like the capital asset pricing model (CAPM), multi-asset model, etc.
Key Takeaways
- Covariance is a statistical tool used to analyze the movement of two variables, or in finance, two investments.
- When it is positive, the investments move in the same direction, i.e., both increase and decrease simultaneously.
- When negative, they move in the opposite direction (one increases while the other decreases).
- It differs from correlation and variance, though all are related mathematical concepts.
- Correlation measures the strength or extent of the relationship between two variables, whereas variance measures the spread of data from the mean.
Covariance Explained
Covariance meaning can be referred to as an analysis tool or metric that establishes the relationship movement of two variables. The relationship can be positive or negative. For example, if the variables move in the same direction, there is a positive relationship. That is, even if both the variables fall together, they would have a positive relationship. On the contrary, the relationship is negative if the variables move in the opposite direction.
For example, let’s consider two variables – car sales and demand for gas. When car sales decreases, demand for gas increases too. Hence, they have a positive relationship. Now, consider another set of two variables – sales of gasoline cars and electric cars. As the sales of electric cars increase, sales of the others decrease. Hence, they have negative covariance.
It is necessary to highlight the difference between covariance, variance, and correlation. Variance refers to the extent of deviation in a single variable. Correlation is the extent of change of one variable concerning another. But correlation is not concerned with the directional change in variables.
Covariance Calculation
It is possible to calculate the directional relationship between two variables or stocks using the covariance formula:
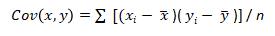
Here, x and y are the datasets of two investments, A and B, respectively.
xi= Individual data of investment A
= Mean data value of investment A
yi= Individual data of investment B
= Mean data value of investment B
n = The population size or total number of observations
Alternatively, covariance can be easily calculated by using excel. Therefore, it is advisable to use excel for large sets of data. Here’s how it works:
Excel >> Toolbar >> Formulas >> More Functions >> Statistical >> COVARIANCE.P/ COVARIANCE.S.
COVARIANCE.P is ideal for the entire population dataset, whereas COVARIANCE.S is ideal for the sample dataset.

Or, click on an empty cell and enter the formula, =COVARIANCE.P or =COVARIANCE.S and add the data by arrays. This gives the result too.
Now, let’s work out a calculation using the covariance formula and the excel tool.

Interpretation
In finance, specifically the stock market, covariance analysis is used to study investments. Financial advisors often select two investments that have a negative relationship to diversify the portfolio. It sort of works like hedging or taking opposite positions in investments.
Therefore, when one investment fails to provide the desired returns or falls in the market, another investment, which shares a negative relationship with the first investment, should give more than desired results.
For example, consider two stocks – AMC Entertainment Holdings Inc. and Netflix Inc. The former is a theatre chain in the United States, whereas the latter is an online streaming platform.
Before COVID-19, both stocks were performing fine. But when the pandemic struck and lockdowns were imposed, the stocks of AMC went down. Simultaneously, that of Netflix shot up. A year later, when restrictions were eased, Netflix stocks plummeted, whereas AMC stocks rose. This is because these stocks have a negative relationship.
Examples
Let’s consider a few examples to understand covariance.
Example #1
Over nine months, consider the mean prices of two stocks, A and B.
| A | 23.4 | 32.5 | 28.9 | 29.6 | 34.1 | 38.3 | 45.2 | 56.1 | 60.8 |
| B | 78.9 | 79.2 | 55.8 | 56.2 | 58.4 | 60.2 | 61.7 | 61.9 | 62 |
Here, it is obvious that A and B stock prices increase and decrease on the same days. Thus, they have positive covariance.
Example #2
As mentioned, covariance is widely used in stock markets and portfolio management. More specifically, the multi-asset model could use covariance to calculate the volatility, risk, and returns of different investments containing a portfolio.
The concept was propagated in the Bloomberg Quants seminar in November 2020. Constructing a covariance matrix, which can give the covariance between any two investments in a portfolio, is particularly helpful in multi-asset volatility arbitrage.
Properties Of Covariance
Given below are the characteristic properties of covariance analysis:
- It can be positive, negative, or zero and can assume any value, from negative to positive infinity.

- It is restricted to variables. The two entities should not be static but keep changing over time. Only then is it possible to study their relationship. If a constant and variable combination is used, the result will be zero.
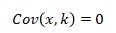
Where k is a constant.
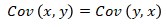
- It is symmetric. That is, the study of directional change of a variable x to another variable y is the same as studying the change in y to x.
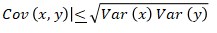
- The modulus of covariance of two variables is less than or equal to the product of square roots of the individual variances.
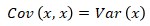
- The covariance of a variable taken twice gives its variance.
Frequently Asked Questions (FAQs)
Can covariance be negative?
Yes. Covariance can assume any value, including zero, from negative to positive infinity. A negative value means that the relationship between two variables is inverse. When one variable increases, the other decreases, and vice versa.
What is a covariance matrix?
The values of different investments are entered in a square matrix. Then, the covariance of each investment with the other investment is determined. This can help find the most diametrically opposite investments to diversify the portfolio.
How to calculate covariance in excel?
To find covariance, open excel, select the dataset, and click on ‘Formulas.’ Under this, choose ‘More Functions’ and select ‘Statistical.’ Next, scroll down to find ‘COVARIANCE.P’ or ‘COVARIANCE.S,’ and choose the appropriate one. The former is for the entire population or dataset, while the latter is for the sample dataset. Similarly, it is possible to find other statistical metrics like correlation, variance, regression, etc., using excel.
Recommended Articles
This article has been a guide to Covariance and its meaning. Here we explain how to calculate it, its interpretations, properties, and examples. You can also go through our recommended articles on corporate finance –