Part of our Interest Rates guide
What is Effective Annual Rate (EAR)?
Effective annual rate (EAR) is the rate actually earned on investment or paid on the loan after compounding over a given period of time and is used to compare financial products with different compounding periods i.e. weekly, monthly, annually, etc. As the compounding periods are increased, the EAR increases.
An effective annual rate equation is crucial in finance as it provides a comprehensive view of the true annual cost of borrowing or the annual return on investments. It factors in compounding, enabling consumers and investors to make informed decisions by comparing different financial products accurately. Understanding EAR helps individuals make financially savvy choices, saving them money and optimizing investment decisions.
Effective Annual Rate Explained
Effective Annual Rate (EAR), also known as the Annual Equivalent Rate (AER) in some regions, is a pivotal concept in the realm of finance. It serves as a crucial metric for evaluating the true cost of borrowing or the actual return on investments over the course of a year. In essence, it provides a more accurate representation of the annual interest rate than nominal or stated rates, especially when interest compounds multiple times within a year.
To understand the significance of EAR, it’s essential to grasp the concept of compounding. Compounding is the process by which interest is calculated not just on the initial principal amount but also on any accrued interest from prior periods.
When dealing with financial products that employ compounding, such as savings accounts, loans, or credit cards, the nominal interest rate alone can be misleading.
Here’s where EAR comes into play. It takes into account the frequency of compounding, ensuring a more precise reflection of the overall cost or gain over a year. By incorporating compounding, an effective annual rate calculator allows individuals to make informed decisions by accurately comparing different financial products.
For instance, suppose we are comparing two savings accounts. One offers an annual interest rate of 5% compounded quarterly, while the other offers 5% compounded monthly. While the nominal rate is the same, the EAR will differ. The account with monthly compounding is likely to have a higher EAR, which means it will yield more interest over the year. Understanding this distinction empowers consumers to select the most favorable financial options and optimize their financial decisions.
It allows individuals to make informed choices, save money, and maximize the potential of their investments by factoring in the impact of compounding.
The Hargreaves Lansdown provides access to a range of investment products and services for UK investors.
Formula
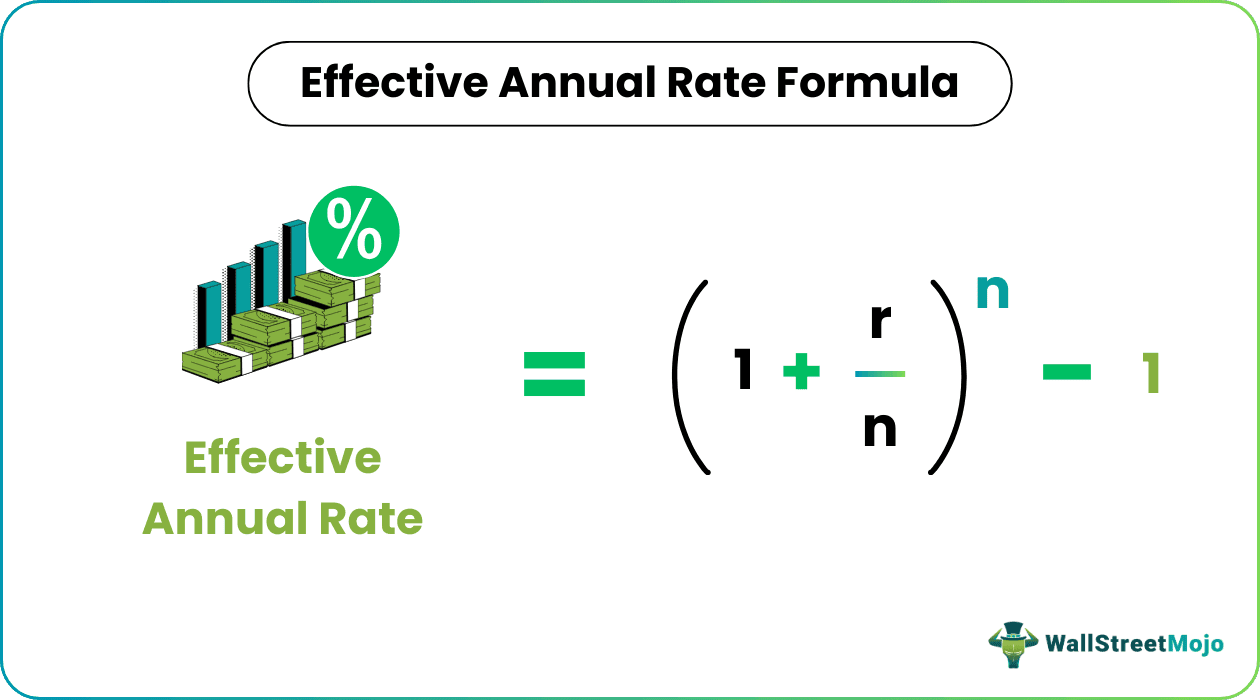
Let us understand the formula that shall act as the very basis of our understanding of an effective annual rate through the discussion below.
Effective Annual Rate = (1 + i/n)n – 1
- Where n = number of compounding periods
- i = nominal rate or the given annual rate of interest
You are free to use this image on your website, templates etc, Please provide us with an attribution link
The EAR is equal to the nominal rate only if the compounding is done annually. As the number of compounding periods increase, the EAR increases. If it is continuous compounding formula, the EAR is as follows:
Effective Annual Rate (in case of continuous compounding) = ei – 1
Hence, the calculation of the Effective annual rate depends on two factors:
- The nominal rate of interest
- The number of compounding periods
The number of compounding periods is the major factor as the EAR increases with the number of periods.
Examples
Now that we understand the basics, formula, and related factors of using an effective annual rate calculator, let us apply this knowledge to practical application through the examples below.
Example #1
Let us consider the following example:
Consider a nominal rate of 12%. Let us calculate the effective annual rate when the compounding is done annually, semi-annually, quarterly, monthly, weekly, daily, and continuously compounded.
Annual Compounding:
- EAR = (1 + 12%/1)1 – 1 = 12%
Semi-Annual Compounding:
- EAR = (1 + 12%/2)2 – 1 = 12.36%
Quarterly Compounding:
- EAR = (1 + 12%/4)4 – 1 = 12.55%
Monthly Compounding:
- EAR = (1 + 12%/12)12 – 1 = 12.68%
Weekly Compounding:
- EAR = (1 + 12%/52)52 – 1 = 12.73%
Daily Compounding:
- EAR = (1 + 12%/365)365 – 1 = 12.747%
Continuous Compounding:
- EAR = e12% – 1 = 12.749%
Thus, as can be seen from the above example, the calculation of the effective annual rate is highest when it is continuously compounded and the lowest when the compounding is done annually.
Example #2
The calculation is important while comparing two different investments. Let us consider the following case.
An investor has $ 10,000, which he can invest in a financial instrument A, which has an annual rate of 10% compounded semi-annually, or he could invest in a financial instrument B, which has an annual rate of 8% compounded monthly. We need to find which financial instrument is better for the investor and why?
To find which instrument is better, we should find the amount he will get after one year from each of the investments:
Amount after one year in Investment A = P * (1 + i/n)n
Where P is the principal, I is the nominal rate, and n is the number of periods of compounding, which is 2 in this case.
- Hence, amount after one year in investment A = 10000 * (1 + 10%/2)2 A = $ 11025
Amount after one year in Investment B = P * (1 + i/n)n
Where P is the principal, I is the nominal rate, and n is the number of periods of compounding, which is 12 in this case.
- Hence, amount after one year in investment A = 10000 * (1 + 8%/12)12= B = $ 10830
Thus, in this case, investment A is a better option for the investor since the amount earned after one year is more in investment A.
If the interest is compounded, it results in higher interest in the subsequent periods, the highest being in the last period. Till now, we have considered total amounts at the end of the year.
Example #3
Let us see the following example to find interest at the end of each period.
A financial instrument had an initial investment of $ 5000, with an annual rate of 15% compounded quarterly. Let us calculate the quarterly interest received on the investment.
The rate is compounded quarterly. Hence the interest rate for each quarter = 15%/4 = 3.75%
Interest earned in first quarter = P(1+i/n)n – P = 5000*(1+15%/4) – 5000 = $ 187.5
- Now, the new principal is 5000 + 187.5 = $ 5187.5
Thus, Interest earned in second quarter = P(1+i/n)n – P = 5187.5*(1+15%/4) – 5187.5= $ 194.53
- Now, the new principal is 5187.5+ 194.53 = $ 5382.03
Thus, Interest earned in third quarter = P(1+i/n)n – P = 5382.03*(1+15%/4) – 5382.03= $ 201.82
- Now, the new principal is 5382.03+ 201.82 = $ 5583.85
Thus, Interest earned in fourth quarter = P(1+i/n)n – P = 5583.85*(1+15%/4) – 5583.85= $ 209.39
- Hence, the final amount after one year will be 5583.85 + 209.39 = $ 5793.25
The above example shows that the interest earned in the fourth quarter is the highest.
Effective Annual Rate Vs Nominal Annual Rate
Let us understand the differences between effective and nominal annual rate through the comparison below.
Effective Annual Rate
- Accounts for the effect of compounding by considering how often interest is added to the principal amount.
- Offers a more precise reflection of the true annual cost of borrowing or the annual return on investments.
- Enables consumers to make informed decisions by allowing apples-to-apples comparisons of financial products with different compounding periods.
- Essential for understanding the real impact of interest rates on loans, savings, and investments.
- Empowers individuals to select the most favorable financial options and optimize their financial decisions by factoring in compounding effects.
Nominal Annual Rate
- Represents the interest rate as stated by the lender or financial institution.
- Doesn’t consider the impact of compounding on interest calculations.
- Often used for simplicity in advertising loans or savings accounts.
- Can be misleading when comparing financial products with different compounding frequencies.
- Doesn’t provide an accurate picture of the actual annual cost or return.
Disclosure: This article contains affiliate links. If you sign up through these links, we may earn a small commission at no extra cost to you.
Recommended Articles
This article has been a guide to what is Effective Annual Rate. Here we explain its formula, and examples of EAR, and compare it with the nominal annual rate. You can learn more from the following articles –