Financial Liabilities Definition
Financial Liabilities for businesses are like credit cards for an individual. They are handy because the company can employ “others’ money” to finance its business-related activities for some period, which lasts only when the liability becomes due. However, one should be mindful that excessive financial liabilities can put a dent in the balance sheet and take the company to bankruptcy.
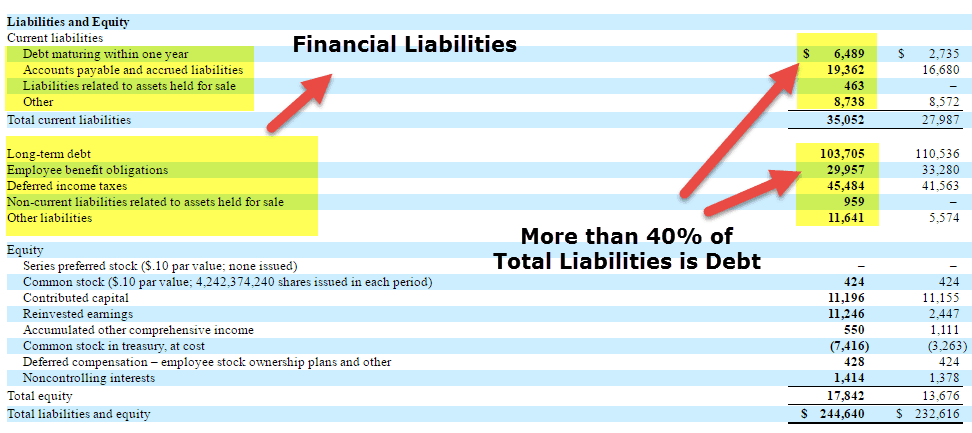
source: verizon
Net financial liabilities can be based on equitable obligations like a duty based on ethical or moral considerations or can also be binding on the entity as a result of a constructive obligation which means an obligation that is implied by a set of circumstances in a particular situation, as opposed to a contractually based obligation.
Financial Liabilities Explained
Financial liabilities are obligations or debts owed by an entity to external parties, often involving the repayment of funds or providing goods or services in the future. They include loans, bonds, accounts payable, and other contractual obligations that result in a future cash outflow.
Any future sacrifices of economic benefits that an entity must make as a result of its past transactions or any other activity in the past. The future sacrifices to be made by the entity can be in the form of any money or service owed to the other party.
Other financial liabilities may usually be legally enforceable due to an agreement between two entities. But they are not always necessarily legally enforceable.
Financial liabilities include debt payable and interest payable, which is as a result of the use of others’ money in the past, accounts payable to other parties, which are as a result of past purchases, rent and lease payable to the space owners, which are as a result of the use of others’ property in the past and several taxes payable which are as a result of the business carried out in the past. Almost all of the financial liabilities can be listed on the entity’s balance sheet.
There is no single method for analyzing financial liabilities. However, finding meaningful ratios and comparing them with other companies is one well-established and recommended method to decide over investing in a company. There are specific traditionally defined ratios for this purpose. But you can very well come up with your ratios depending the purpose of the analysis.
Financial Liabilities Video
Types
Liabilities are classified into two types based upon the period within which they become due and are liable to be paid to the creditors. Based on this criterion, the two types of liabilities are Short-term or current and long-term liabilities. Let us understand the different types of other financial liabilities through the detailed explanation below.
Short term Liabilities

source: verizon
- Short-term or current liabilities are those payable within one year (next 12 months) from when the company receives the economic benefit.
- In other words, the liabilities that belong to the current year are called short-term or current liabilities.
- For example, if a company has to pay yearly rent by occupying land or office space, that rent will be categorized under current or short-term liabilities.
- Similarly, the interest payable and that part of long-term debt payable within the current year will come under short-term or current liabilities.
Long term liabilities

source: verizon
- Long-term liabilities are those payable over longer than one year.
- For example, if a business takes out a mortgage payable over 15 years, it will come under long-term liabilities.
- Similarly, all the debt not required to be paid within the current year will also be categorized as a long-term liability.
Long term and Short term liabilities
For most companies, the long-term liabilities comprise mostly the long-term debt, which is often payable over periods longer than a decade. However, the other items classified as long-term liabilities include debentures, loans, deferred tax liabilities, and pension obligations.
On the other hand, so many items other than interest and the current portion of long-term debt can be written under short-term liabilities. Other short-term liabilities include payroll and accounts payable, which include money owed to vendors, monthly utilities, and similar expenses.
If a company has a short-term liability that it intends to refinance, some confusion is likely to arise in your mind regarding its classification. To clear this confusion, it is required to identify whether there is any intent to refinance and whether the refinancing process has begun. If yes, and if the refinanced short-term liabilities (debt in general) are going to become due over some time longer than 12 months due to refinancing, they can very well be reclassified as long-term liabilities.
Hence, only one criterion forms the basis of this classification: the next one-year or 12-month period.
Analysis
What is the need to analyze the liabilities of a company?
And who are the people most affected by a company’s liabilities?
Well, liabilities, after all, result in a payout of cash or any other asset in the future. So, by itself, a liability must always be looked upon as unfavorable. Still, financial liabilities must not be viewed in isolation when analyzing them. It is essential to realize the overall impact of an increase or decrease in liabilities and the signals that these variations in liabilities send out to all those who are concerned.
The people whom the net financial liabilities impact are the investors and equity research analysts involved in purchasing, selling, and advising on the shares and bonds of a company. They have to determine how much value a company can create for them in the future by looking at the financial statements.
For the above reasons, experienced investors take a good look at liabilities while analyzing the financial health of any company to invest in them. To quickly size up businesses in this regard, traders have developed several ratios that help them separate healthy borrowers from those drowning in debt.
Ratios
All items under net financial liabilities are similar to debt, which must be paid to the creditors in the future. For this reason, when doing the ratio analysis of the financial liabilities, we call them debt in general: long-term debt and short-term debt. Therefore, wherever a ratio has a term called debt, it would mean liabilities.
You can also learn step-by-step financial statement analysis here
The following ratios are used to analyze the financial liabilities:
#1 – Debt Ratio
The debt ratio compares a company’s total debt (long term plus short term) with its total assets.
Debt ratio Formula =Total debt/Total assets=Total liabilities/Total assets
- This ratio shows the company’s leverage, i.e., the money borrowed from and owed to others.
- Sometimes analysts use it to gauge whether the company can pay out all its liabilities if it goes bankrupt and has to sell off all its assets.
- That’s the worst that can happen to a company. So if this ratio is greater than 1, the company has more debt than the cash it can have on selling its assets.
- Hence, the lower the value of this ratio, the stronger the company’s position is. And thus, investing in such a company becomes as much less risky.
- However, generally the current portion of total liabilities, i.e., the current liabilities (including the operational liabilities, such as accounts payable and taxes payable), is not as risky as they don’t need to be funded by selling off the assets.
- A company usually funds them through its current assets or cash.
So a clearer picture of the debt position can be seen by modifying this ratio to the “long-term debt to assets ratio.”
#2 – Debt to equity ratio
This ratio also gives an idea of the leverage of a company. It compares a company’s total liabilities to its total shareholders’ equity.
Debt to equity ratio = Total debt/Shareholder’s Equity
- This ratio shows how much its suppliers, lenders, and creditors are invested in the company compared to its shareholders.
- It also tells about the capital structure of the company. The lower this ratio is, the lesser the leverage and the stronger the position of the company’s equity.
- Again, you can analyze the long-term debt against the equity by removing the current liabilities from the total liabilities. That’s the analyst’s choice as to what he is trying to analyze.
#3 – Capitalization ratio
This ratio specifically compares a company’s long-term debt and the total capitalization (i.e., long-term debt liabilities plus shareholders’ equity).
Capitalization ratio = Long term debt/(Long term debt +Shareholder’s equity)
- This ratio is considered one of the more meaningful of the “debt” ratios – it delivers critical insight into a company’s use of leverage.
- If this ratio has a low value, it would mean that the company has a small long-term debt and a high amount of equity.
- And it is well known that a low level of debt and a healthy proportion of equity in a company’s capital structure indicate financial fitness.
- Hence, a low value of capitalization is considered favorable by an investor.
#4 – Cash flow to total debt ratio
This ratio gives an idea about a company’s ability to pay its total debt by comparing it with the cash flow generated by its operations during a given period.
Cash flow to debt ratio = Operating cash flow/total debt.
- The total debt does not entirely belong to the given period since it also includes the long-term debt.
- Still, this ratio indicates whether the cash generated from operations would suffice to pay the debt in the long term.
- Unlike the above three ratios, the debt-related number (Total debt) comes in the denominator here.
- So, the more the operating cash flow is, the greater this ratio is. Thus, a greater value of this ratio is considered more favorable.
#5 – Interest coverage ratio
An interest coverage ratio gives an idea about the ability of a company to pay its debt by using its operating income. It is the company earnings before interest and taxes (EBIT) ratio to the company’s interest expenses for the same period.
Interest coverage ratio=EBIT/Interest expense
- A greater value of this ratio must be considered favorable, while a lower value must be considered unfavorable for investment.
- This ratio is quite different from the above four ratios by being a short-term liability-related ratio.
- It only considers the interest expense, which is essentially one of the short-term liabilities.
- Also, do have a look at the Debt Service coverage Ratio (important for credit analysts)
#6 – Current Ratios and Quick Ratios
The current and quick ratios are significant among other ratios used to analyze the short-term liabilities. Both help an analyst determine whether a company can pay off its current liabilities.
The current ratio is the ratio of total current assets to the total current liabilities.
Current ratio=Total current assets/Total current liabilities
- The current ratio is a liquidity ratio that measures a company’s ability to pay short-term and long-term obligations.
The quick ratio is the ratio of the total current assets and fewer inventories to the current liabilities.
Quick ratio= (Total current assets-Inventories)/Total current liabilities
- The quick ratio measures a company’s ability to meet its short-term obligations with its most liquid assets.
The above ratios are some of the most common ratios used to analyze a company’s liabilities. However, there is no limit to the number and type of ratios to be used.
- You can take any suitable terms and their ratio per your analysis’s requirement. The only aim of using the ratios is to get a quick idea about the components, magnitude, and quality of a company’s liabilities.
- Also, as is true with any ratio analysis, the type of company and the industry norms must be kept in mind before concluding whether it is high or low on debt when using the above ratios as the basis. It is a comparative analysis, after all!
- For instance, large and well-established companies can push the liability component of their balance sheet structure to higher percentages without getting into trouble, while smaller firms may not.
Examples
Now that we understand the basics of other financial liabilities and its intricacies, let us apply the theoretical knowledge into practical application through the examples below.
Example #1
These days, the whole oil exploration and production industry suffers from an unprecedented piling up of debt. Exxon, Shell, BP, and Chevron have combined debts of $ 184 billion amid a two-year slump. The reason is that crude oil prices have remained lower than profitable levels for too long. And these companies did not expect this downturn to extend this long. So they took too much debt to finance their new projects and operations.
But now, since the new projects have not turned profitable, they cannot generate enough income or cash to pay back that debt. Their income coverage ratios and Cash flow to debt ratios have seriously declined, making them unfavorable to invest in.
Exxon Mobil Debt to Equity (Quarterly Chart)

source: ycharts
As the investment becomes unfavorable, investors pull out their money from the stock. As a result, the debt-to-equity ratio increases, as can be seen in the case of Exxon Mobil in the above chart.
Oil companies are now trying to generate cash by selling some of their assets every quarter. If they have enough assets, they can get enough cash by selling them off and paying the debt as it comes due. So, their debt-paying ability presently depends upon their Debt ratio.
Example #2
On the other hand, companies like Pan American Silver (a silver miner) are low on debt. Pan American had a debt of only $ 59 million compared to the cash, cash equivalents, and short-term investments of $ 204 million at the end of the June quarter of 2016. The ratio of debt to cash, cash equivalents, and short-term investments is just 0.29. Cash, cash equivalents, and short-term investments are the most liquid assets of a company. And the total debt is only 0.29 times that. So, from the viewpoint of “ability to pay the debt,” Pan American is a very favorable investment compared to those oil companies.
Pan America Silver Debt to Equity (Quarterly)

source: ycharts
Now, the above chart of Pan American also shows an increase in debt to equity ratio. But look at the value of that ratio in both charts. It’s 0.261 for Exxon and only 0.040 for Pan American. This comparison shows that investing in Pan American is much less risky than investing in Exxon.
Importance
Although liabilities are necessarily future obligations, they are a vital aspect of a company’s operations because they are used to finance operations and pay for significant expansions. Let us understand the importance of net financial liabilities through the points below.
- Liabilities also make business transactions more efficient to carry out. For instance, if a company needs to pay for every little purchased quantity every time the material is delivered, it would require several repetitions of the payment process within a short period.
- On the other hand, if the company gets billed for all its purchases from a particular supplier over a month or a quarter, it would clear all the payments owed to the supplier in a minimal number of transactions.
- However, they all have a date of maturity, stated or implied, on which they come due. Once liabilities come due, they can be detrimental to the business.
- Defaulting or delaying liability payment may add more liabilities to the balance sheet in the form of fines, taxes, and increased interest rates.
- Further, such acts can also damage the company’s reputation and affect the extent to which it will be able to use that “others’ money” in the future.
Financial Liabilities Vs Non-Financial Liabilities
In essence, financial liabilities are specifically tied to monetary commitments, while non-financial liabilities involve a broader range of responsibilities that extend beyond immediate financial transactions.
Financial liabilities and non-financial liabilities are two distinct categories of obligations or debts that an entity might have. Let us understand the differences between the two through the comparison below.
Financial Liabilities
- Financial liabilities involve monetary obligations that require the entity to provide funds or assets to another party.
- These liabilities are typically related to financial transactions, contracts, or agreements where there is a clear financial obligation.
- Examples include loans, bonds, accounts payable, and derivatives.
Non-Financial Liabilities
- Non-financial liabilities encompass obligations that don’t involve a direct financial transaction.
- These liabilities arise from legal or moral responsibilities, and the resolution might not always require a direct payment of funds.
- Examples include legal liabilities, environmental obligations, and warranty provisions.
Recommended Articles
to Financial Liabilities definition. Here we explain its types, ratios, and examples, and compare it with non-financial liabilities. You can learn more about finance through the articles below: