Table Of Contents
Beta Formula Calculation
Beta is a measure of the stock's volatility compared to the overall stock market. We can calculate beta using three formulas –
- Covariance/Variance Method
- By Slope Method in Excel
- Correlation Method
Key Takeaways
- The beta formula measures a stock's volatility relative to the overall stock market. It can be calculated using the covariance/variance method, the slope method in Excel, and the correlation method.
- A beta value of 1 indicates that the stock closely tracks the movements of the overall market.
- A higher beta value suggests that the stock is riskier, as it tends to have more significant price fluctuations compared to the market. Conversely, a lower beta indicates less volatility compared to the market.
Top 3 Formula to Calculate Beta
Let us discuss each of the beta formulas in detail -
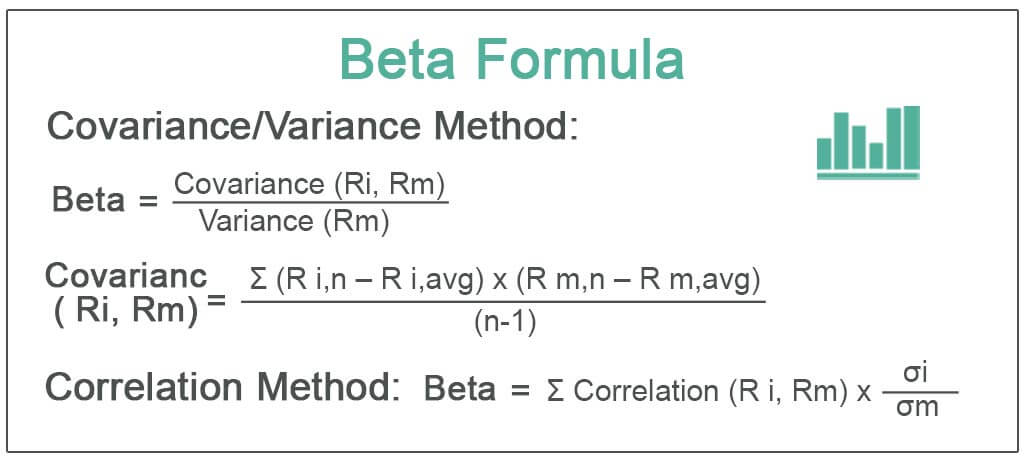
#1- Covariance/Variance Method
Beta Formula = Covariance (Ri, Rm) / Variance (Rm)
Covariance( Ri, Rm) = Σ ( R i,n – R i,avg ) * ( R m,n – R m,avg ) / (n-1)
Variance (Rm) = Σ (R m,n – R m,avg ) ^2 / n
To calculate the covariance, we must know the stock return and the market return, which is taken as a benchmark value. We must also know the variance of the market return.
#2 -By Slope Method in Excel
We can also calculate Beta by using the slope function in excel. The Microsoft Excel SLOPE function returns the slope of a regression line based on the data points identified by % change in NASDAQ and % change of the company, which we are calculating.
% change is calculated as below:
Return = Closing Share Price – Opening Share Price / Opening Share Price

#3 - Correlation Method
Beta can also be calculated using the correlation method. Beta can be calculated by dividing the asset's standard deviation of returns by the market's standard deviation. The result is then multiplied by the correlation of the security's return and the market's return.
Beta Formula = Σ Correlation (R i, Rm) * σi / σm
Step by Step Beta Calculation
Follow the below steps:
- First, download Historical prices and NASDAQ index data from the past three years.
You can download the data from yahoo finance, as I have done below.
#1 - For NASDAQ Dataset, Please visit this link - (finance.yahoo.com/).
#2 - For Google Prices, Please visit this URL - finance.yahoo.com
- Then Sort the Prices as Done Below.
Then we need to sort the dates of the stock prices and adjusted closing prices in ascending order of dates. We need only these two columns, and the remaining columns can be deleted as we donu2019t have use of those for beta calculations in excel.
- Then, prepare the beta coefficient excel sheet, as shown below. We put both the data on one sheet.

- Then calculate Daily Returns we get.
Return = Closing Share Price - Opening Share Price / Opening Share Price - Then, calculate Beta by the Variance-Covariance method.
In this case, we need to use the two formulas (formulas of variance and covariance in excel), as shown below:
Using the variance-covariance method, we get the Beta as 0.16548 (Beta Coefficient) - Calculate Beta using SLOPE Function available in excel

Using this SLOPE function method, we again get the Beta as 1.2051 (Beta Coefficient)
Examples of Beta Formula
Let’s take an example to better understand the beta equation calculation in a better manner.
Using Correlation Method - Example #1
An investor is looking to calculate the beta of company XYZ compared to the NASDAQ. XYZ has a standard deviation of returns of 22.12%, and NASDAQ has a standard deviation of returns of 22.21%. Based on data over the past three years, the correlation between the firm XYZ and NASDAQ is 0.82.
Solution:
Use the following data for the calculation of the beta.

So, the calculation of the beta –

Beta of XYZ = 0.82 x (0.2212 ÷ 0.2221)
Beta of XYZ = 0.817
In this case, Company XYZ is considered less risky than the market NASDAQ with its beta of 0.817.
Example #2
We will discuss some examples using data from the industry.
Now we will take an example to calculate the beta of Google and the Market index as NASDAQ. We will calculate the Beta of Google and Amazon in excel– variance/covariance method, slope function. We will see each of the beta coefficient calculations.
Calculation of Beta of Google using correlation and covariance in excel

We will calculate the beta of Google as compared to NASDAQ.
Based on data over the past three years, take the data from Yahoo finance and calculate Beta as below:-
- Beta = Covariance (Ri, Rm) / Variance (Rm)
- Beta = 0.165
In this case, Google is considered less volatile than NASDAQ, with its beta of 0.165.
Example #3
We will calculate the beta of Amazon as compared to NASDAQ.

Based on data over the past three years, take the data from Yahoo finance and calculate Beta as below:
Beta = Covariance (Ri, Rm) / Variance (Rm)
Beta = 0.000135
In this case, Amazon has zero correlation with the market movements.
Relevance and Uses
Beta indicates whether an investment is more volatile or less volatile. Beta, which has a value of 1, indicates that it exactly moves following the market value.
A higher beta indicates that the stock is riskier, and a lower beta indicates that the stock is less volatile than the market. Most Betas generally fall between the values range 1.0 to 2.0. The beta of a stock or fund is always compared to the market/benchmark. The beta of the market is equal to 1. If a stock is benchmarked against the market and has a beta value greater than 1 (for example, we consider it as 1.6), this indicates that the stock is 60 percent riskier than the market as the market beta is 1.
Beta is used in the formulae of the capital asset pricing model (CAPM), which calculates the expected return of an asset based on the value of beta and expects a market return.