What Is The Cost Of Equity Formula?
Cost of equity (Ke) formula is the method of calculating the return on what shareholders expect to get from their investments into the firm. One can calculate the equity cost by using the dividend discount approach formula or the CAPM model.
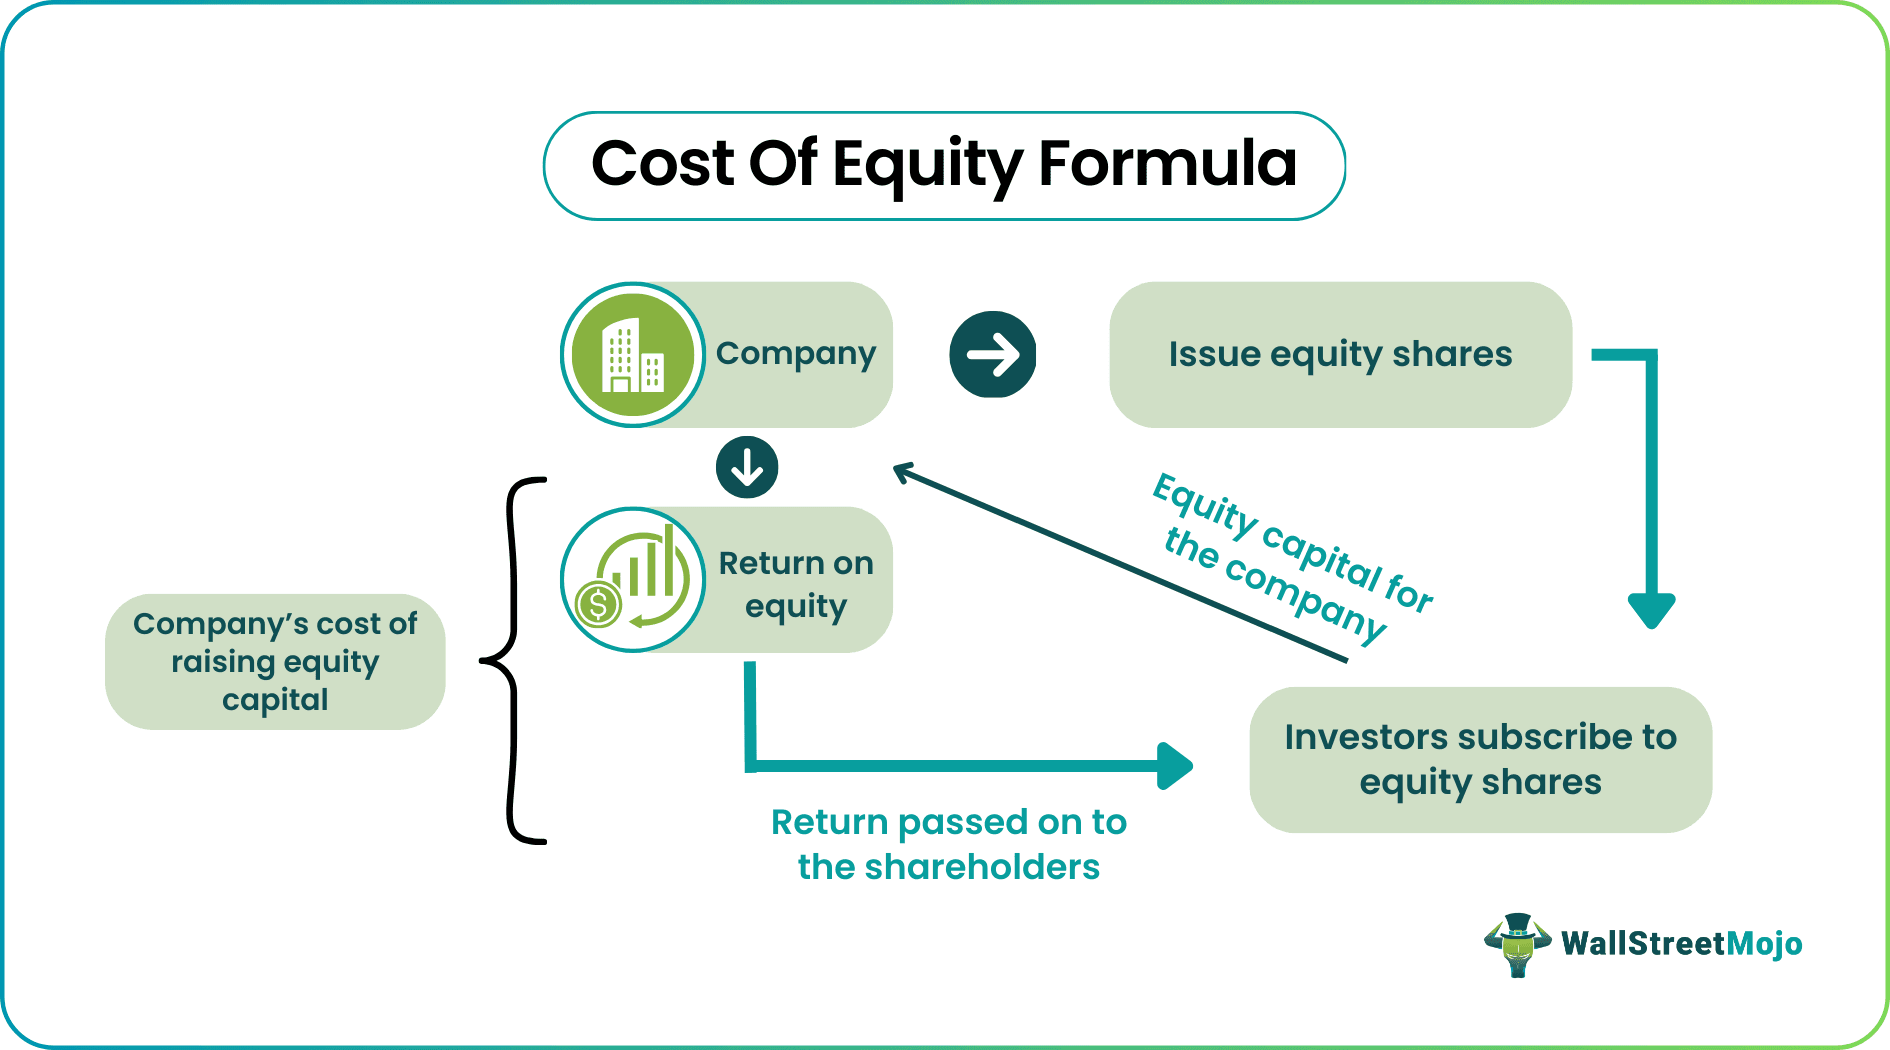
It is the way of computing the return that an organization gives its equity shareholders against the capital they provide to the company. It helps investors assess how profitable the investment is and allows the company to determine the cost of raising funds through the issue of equity. Based on this calculation, the entity decides whether to raise funds through equity or debt.
Key Takeaways
- Cost of equity refers to the return payable percentage by the company to its equity shareholders on their holdings.
- It is a criterion for the investors to determine whether an investment is beneficial. Else, they opt for other opportunities with higher returns.
- Internet and content companies possess various costs of equity due to the diversity in the companies’ Beta.
- CAPM assesses the relationship between risk and needed return in a well-functioning market.
Cost of Equity Formula Explained
Cost of equity formula is used to compute the return that shareholders get from the equity investment in a Company. Similarly, the entity can also decide whether raising capital using equity is more costly or less costly than using debt capital.
It represents the return that the market can expect to receive from the equity investment in a business. This greatly influences the decision that investors take while buying stock. From the entity’s point of view, this information helps them to save cost and maintain the company’s financial strength to ensure growth and expansion.
The most used method of calculating the same is Capital Asset Pricing Model(CAPM) and the dividend discount model. Both the models are discussed in the article in details.
Cost of Equity Formula – Explained in Video

How To Calculate?
Let us understand how to use the cost of equity formula in finance.
Method #1 – Dividend Discount Model
Cost of Equity (Ke) = DPS/MPS + r
Where,
- DPS = Dividend Per Share
- MPS = Market Price per Share
- r = Growth rate of Dividends
The dividend growth model requires that a company pays dividends. Therefore, it is based on upcoming dividends. The logic behind the equation is that the company’s obligation to pay dividends is the cost of producing its shareholders. Therefore, the Ke, i.e., cost of equity. It is a limited model in its interpretation of costs.
Method #2 – CAPM
Below is the cost of equity formula using the Capital Asset Pricing Model.

Where,
- R(f) = Risk-Free Rate of Return
- β = Beta of the stock
- E(m) = Market Rate of Return
- [E(m)-R(f)] = equity risk premium
However, the cost of equity formula CAPM can be used on several stocks, even if they are not paying dividends. With that said, the logic behind CAPM is rather complicated, which suggests the cost of equity (Ke) is based on the stock’s volatility, which is computed by using the cost of equity formula beta and level of risk compared to the general market, i.e., the cost of equity formula market risk premium which is nothing but a differential of Market Return and Risk-Free Rate.
In the CAPM equation, the risk-free rate (Rf) is the rate of return paid on risk-free investments like government bonds or treasuries. Beta, a measure of risk, can be calculated as a regression on the company’s market price. The higher the volatility, the higher the beta will come and its relative risk compared to the general stock market. The market rate of return Em(r) is the average market rate, which has generally been assumed to be 11% to12 % over the past eighty years. A company with a cost of equity formula beta, which is high, will have a high risk and pay more for equity.
Examples
Let us look at the examples to understand the concept.
Calculating Cost Of Equity By Using Dividend Discount Model
Example #1
Let us try the cost of equity calculation with a first formula where we assume a company is paying regular dividends.
Suppose XYZ Co. is a regularly paying dividend company. Its stock price is currently trading at 20, and it expects to pay a dividend of 3.20 next year. The following is the dividend payment history. So, now, let us calculate the company’s cost of equity.
| Year | Dividend Per Share |
|---|---|
| 1 | 3.00 |
| 2 | 3.02 |
| 3 | 3.05 |
| 4 | 3.11 |
| 5 | 3.16 |
Solution:
Let us first calculate the average growth rate of dividends. Then, continuing the same formula as per below will yield yearly growth rates.
So the growth rate for all the years will be-

Take a simple average growth rate, which will come to 1.31%.
Now we have all the inputs i.e.
DPS for next year = 3.20, MPS = 20 and r = 1.31%
Hence
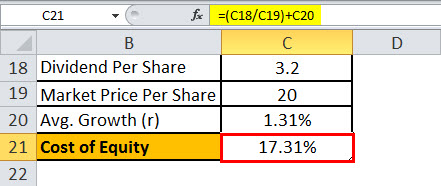
- Cost of Equity Formula= (3.20/20) + 1.31%
- Cost of Equity Formula= 17.31%
- Hence, the cost of equity for XYZ company will be 17.31%.
Example #2
Below is the company’s dividend history, ignoring interim and any special dividend for the time being.
| Announcement Date | Effective Date | Dividend Type | Dividend (%) | Remarks | Dividend Per Share |
|---|---|---|---|---|---|
| 12/04/2018 | 14/06/2018 | Final | 410 | ₹20.5000 per share (410%) Final Dividend | 20.50 |
| 13/04/2017 | 01/06/2017 | Final | 295 | ₹14.7500 per share (295%) Final Dividend | 14.75 |
| 15/04/2016 | 09/06/2016 | Final | 285 | ₹4.2500 per share (285%) Final Dividend | 14.25 |
| 24/04/2015 | 15/06/2015 | Final | 590 | ₹29.5000 per share (590%) Final Dividend (equivalent to ₹ 14.75/- per share after 1.1 bonus issue) | 29.50 |
| 15/04/2014 | 29/05/2014 | Final | 860 | ₹43.0000 per share (860%) Final Dividend | 43.00 |
| 12/04/2013 | 30/05/2013 | Final | 540 | ₹27.0000 per share (540%) Final Dividend | 27.00 |
| 13/04/2012 | 24/05/2012 | Final | 640 | ₹22.00 per share (440%) Final Dividend & ₹10.00 per share (200%) Special Dividend | 22.00 |
The Share price of Infosys is 678.95 (BSE). Its average dividend growth rate is 6.90%, computed from the above table. It paid its last dividend of 20.50 per share.
Therefore,
- Cost of Equity Formula = {[20.50(1+6.90%)]/678.95} +6.90%
- Cost of Equity Formula = 10.13%
CAPM Approach.
Calculation using cost of equity formula CAPM.
Example #1
Below, the three companies’ inputs have arrived. Now we have to calculate their cost of equity.
| Particulars | X | Y | Z |
|---|---|---|---|
| Risk-Free Beta | 3.00% | 3.40% | 4.00% |
| Beta | 1.11 | 0.98 | 1.4 |
| Market Return | 7.00% | 7.00% | 7.00% |
Solution:
First, we will calculate the equity risk premium, which is the difference between market return and risk-free return rate, i.e.,

Then, we will calculate the cost of equity using CAPM, i.e.,
Rf + β [E(m) – R(f)] i.e., Risk-free rate + Beta(Equity Risk Premium)
Continuing the same formula above for all the companies, we will get the cost of equity.
So, the cost of equity for companies X, Y, and Z comes to 7.44%, 6.93%, and 8.20%, respectively.
Example #2
Let us try calculating the cost of equity for TCS through the CAPM model.
For the time being, we will take the 10-year government bond yield at a risk-free rate of 7.46%.

Source: https://countryeconomy.com
Secondly, we need to come up with a cost of equity formula market risk premium.

Source: https://pages.stern.nyu.edu/
For India, the Equity Risk Premium is 7.27%.
We need a beta for TCS, which we have taken from Yahoo finance India.

Source: https://in.finance.yahoo.com/
So the cost of equity (Ke) for TCS will be-
- Cost of Equity Formula = Rf + β [E(m) – R(f)]
- Cost of Equity Formula= 7.46% + 1.13 * (7.27%)
- Cost of Equity Formula= 15.68%
Relevance And Use
- A firm uses a cost of equity (Ke) to assess the relative attractiveness of its opportunities in the form of investments, including external projects and internal acquisitions. Companies will typically use a combination of debt and equity financing, with equity capital proving to be more expensive.
- Investors willing to invest in stock also use a cost of equity to find whether the company is earning a rate of return greater than it, less than it, or equal to that rate.
- Equity Analyst, Research Analyst, buy or sell-side analyst, etc., who are majorly involved in financing modeling and issuing research reports, uses the cost of equity to arrive at the valuation of the companies they follow. Then, advise whether the stock is over or undervalued and then make an investment decision.
- Many other methods are also used to compute the cost of equity, which are running a regression analysis, multi-factor model, survey method, etc.
Cost of Equity Formula in Excel (with Excel template)
Let us take the case mentioned in example no.1 to illustrate the same in cost of equity formula excel.
Suppose XYZ Co. is a regularly paying dividend company. Its stock price is currently trading at 20. It expects to pay a dividend of 3.20 next year. The following is the dividend payment history.
In the below-given table is the data for calculating the cost of equity.

In the below given cost of equity formula excel template, we have used the cost of equity equation calculation to find the cost of equity.
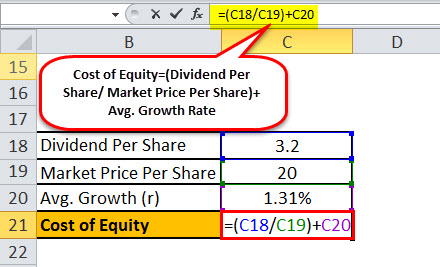
So the calculation of the cost of equity will be-
Frequently Asked Questions (FAQs)
How to calculate cost of equity for WACC?
For the cost of equity for WACC calculation, one must use the formula: Cost of equity = Risk-free rate of return + Beta * (market rate of return – a risk-free rate of return).
Is cost of equity a percentage?
Yes, the cost of equity refers to the percentage return enforced by a company’s owners. Whereas it differs from the cost of capital as it involves the rate of return required by lenders and owners.
Why does cost of equity increase with leverage?
The financial leverage is in direct proportion to the cost of equity. Therefore, in case of a rise in the debt component, the equity shareholders notice a higher risk to the company. So, in return, the shareholders anticipate a higher return by increasing the equity cost.
Why is cost of equity important?
The cost of equity is the return that a company must realize in exchange for a given investment or project. Therefore, if a company determines to take on new financing, the cost of equity identifies the return that the company obtains to authorize the unique opportunity.
Recommended Articles:
This article is a guide to the Cost of Equity Formula. Here, we learn two methods of calculation of the cost of equity with examples. You may learn more about valuations from the following articles: –