What Is A Beta In Finance?
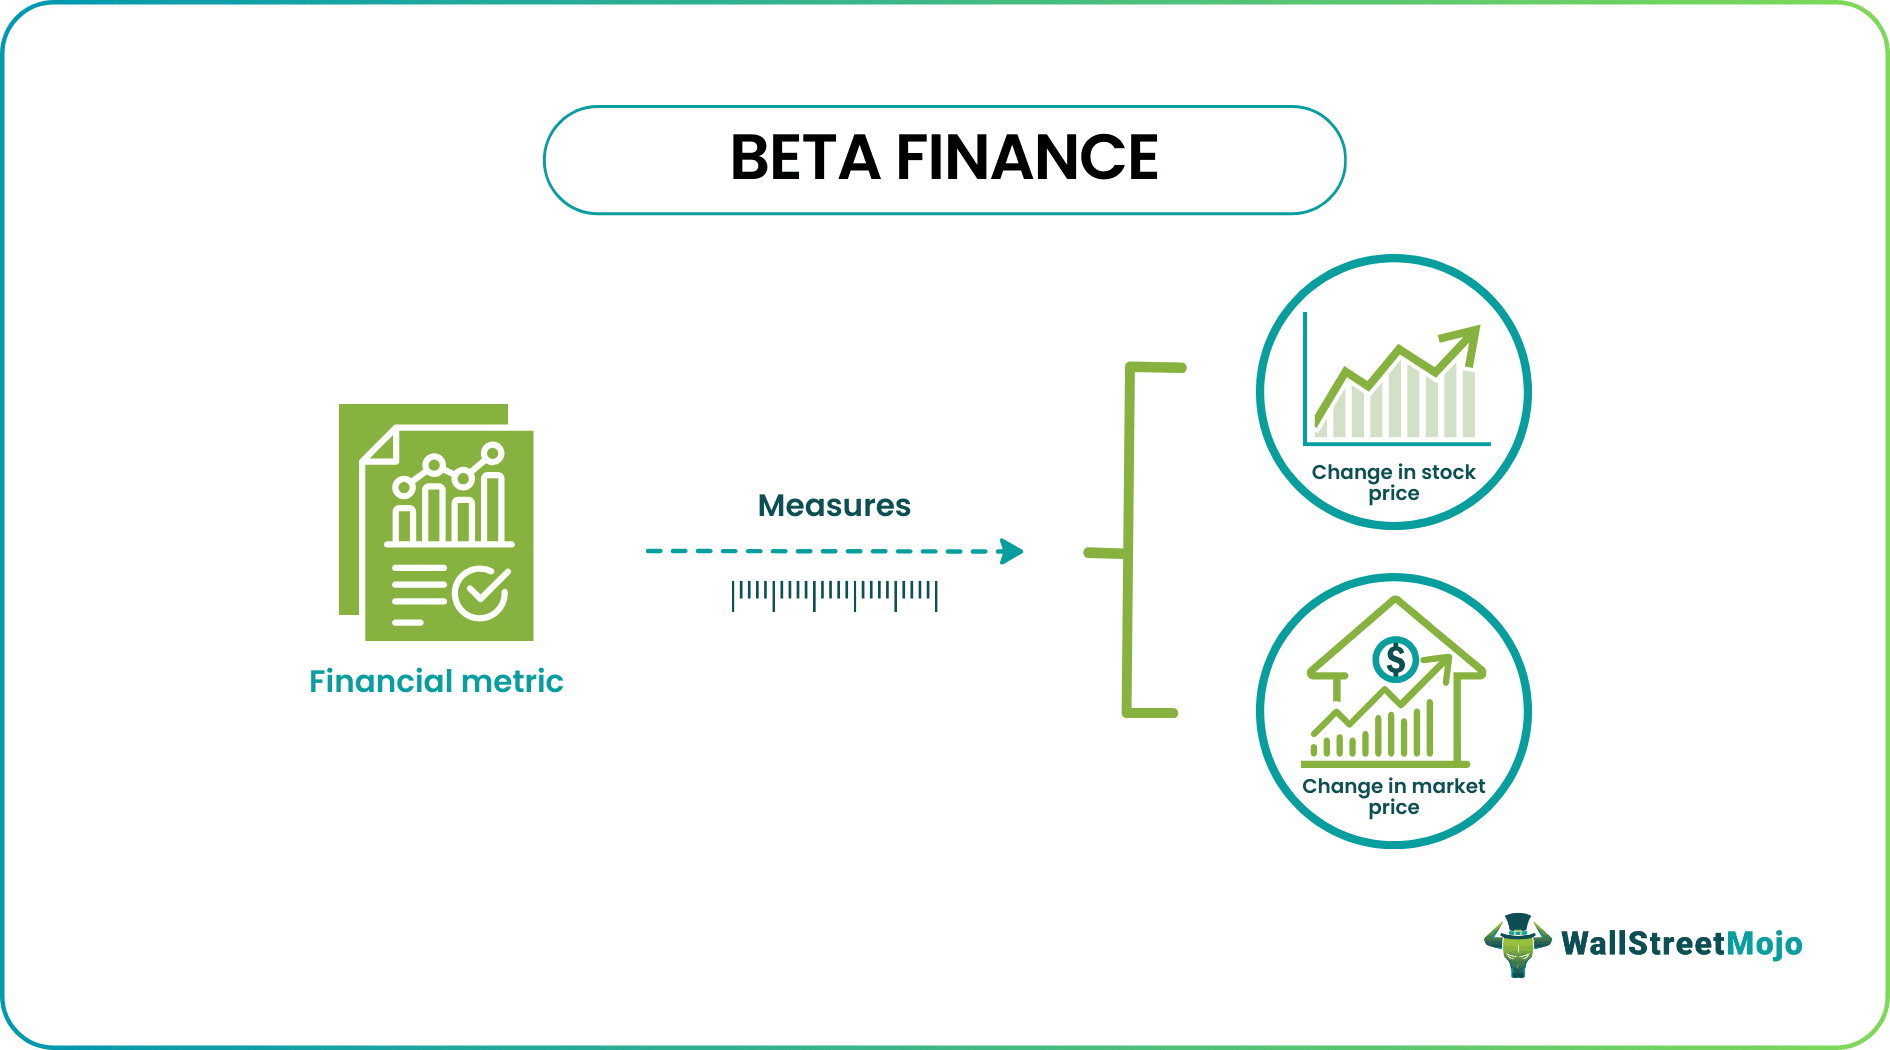
The beta in finance is a financial metric that measures how sensitive is the stock price concerning the change in the market price (index). The Beta is used for measuring the systematic risks associated with the specific investment. In statistics, beta is the slope of the line, which is obtained by regressing the returns of stock return with that of the market return.
Beta is mainly used in calculating CAPM (Capital Asset Pricing Model). This model calculates the expected return on an asset using expected market returns and beta. CAPM is mainly used in calculating the cost of equity. These measures are very important in the valuation method of DCF.
Key Takeaways
- Beta quantifies the influence of the overall market on a stock’s price, aiding in the assessment of investment risk by comparing stock returns to market returns through a slope calculation.
- Beta holds significant importance in the Capital Asset Pricing Model (CAPM) for estimating expected asset returns. It plays a crucial role in determining the cost of equity and is essential for the Discounted Cash Flow (DCF) valuation method.
- Beta is valuable in evaluating systematic risk but does not guarantee future returns. While it can be calculated over various periods, past data may not accurately predict future stock movements, posing challenges in making accurate predictions.
Beta In Finance Explained
The concept of beta value in finance measures the volatility or the systematic risk of the stocks or any kind of investment with relation to the overall market. The helps in expressing the level of sensitivity of the returns of an asset to the changes in return from the market.
It compares the price movement of the asset to the price movements of the index that is taken as the benchmark. The index has a beta of 1, which is taken as an average market risk. In such a case, if the beta is more than 1, the volatility of the stick is more than the market and if it is less than 1, the volatility of the stock is less than the market.
The beta factor in finance is a concept that is widely used in the financial market because investors are able to use it to evaluate the return and the level of risk from an investment. The investors can easily compare the volatility levels of various assets to make an informed decision about risk management and diversification of their portfolio. But in this case the data used is related to the past and thus it may not provide accurate results for the future estimates.
Formula
The CAPM formula uses beta value in finance as per the below formula –
Cost of Equity = Risk-Free Rate + Beta x Risk Premium
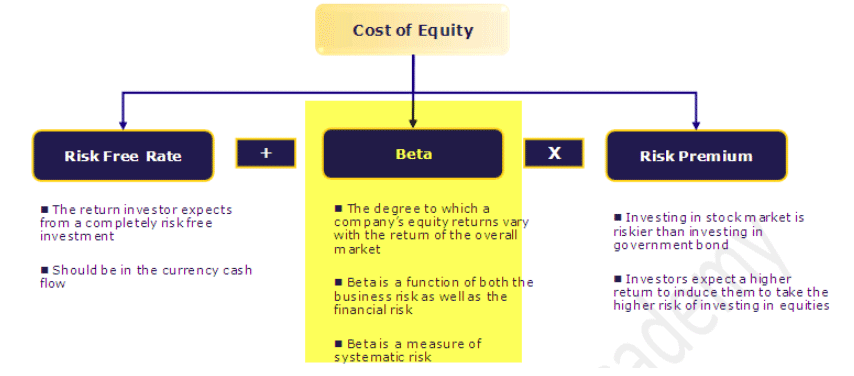
- Risk-free rates are usually government bonds. For example, 10-year government bonds are used at risk-free rates in the UK and US. This return is what an investor expects to gain by investing in a completely risk-free investment.
- Beta is the degree to which the company’s equity returns vary compared to the overall market.
- Risk Premium is given to the investor for taking on additional risk by investing in that stock. Since the risk from investing in the risk-free bond is much less than the equities, investors expect a higher return to take on higher risk.
How To Calculate?
Let us find out how the beta factor in finance can be calculated by investors and analysts using the methods given below:
#1-Variance-Covariance Method
The beta of a security is calculated as the covariance between the return of the market and the return on security divided by the variance of the market.
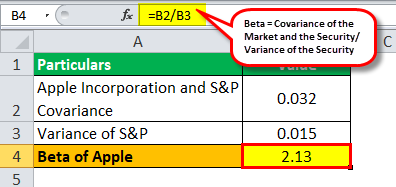
Beta = Covariance of the Market and the Security/ Variance of the Security
Beta of Apple = 0.032/0.015 = 2.13
#2-Standard Deviation and Correlation Method
The beta in business finance can also be calculated by dividing –
- Standard Deviation of the return of the securities divided by the standard deviation of the benchmark returns.
- This value is then multiplied by the market and securities returns correlation.
Examples
Let us try to understand the concept of beta in business finance with the help of some suitable examples.
Example #1
Let’s assume a portfolio manager wants to calculate beta for Apple incorporation and wants to include it in its portfolio. He decides to calculate it against its benchmark, the S&P 500. Based on the past year’s data, Apple incorporation and S&P have a covariance of 0.032, and the variance of S&P is 0.015.
Beta of Apple = 0.032/0.015 = 2.13
Example #2
An investor is looking to invest in Amazon but is worried about the volatility of the stock. He, therefore, decided to calculate Beta for Amazon in comparison to the S&P 500. Based on the past data, he found out that the correlation between the S&P 500 and Amazon is 0.83. Amazon has a standard deviation of returns of 23.42%, while S&P 500 has a standard deviation of 32.21%
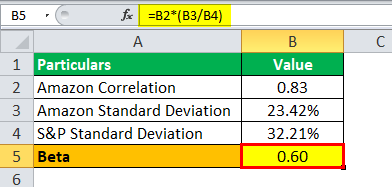
Beta = 0.83 x (23.42% divided by 32.21%)= 0.60
The beta for the market is 1, while for Amazon is 0.60. It indicates that the beta for Amazon is lower than the market, and it means that the stock has experienced 40% less volatility than the market.
Interpretation
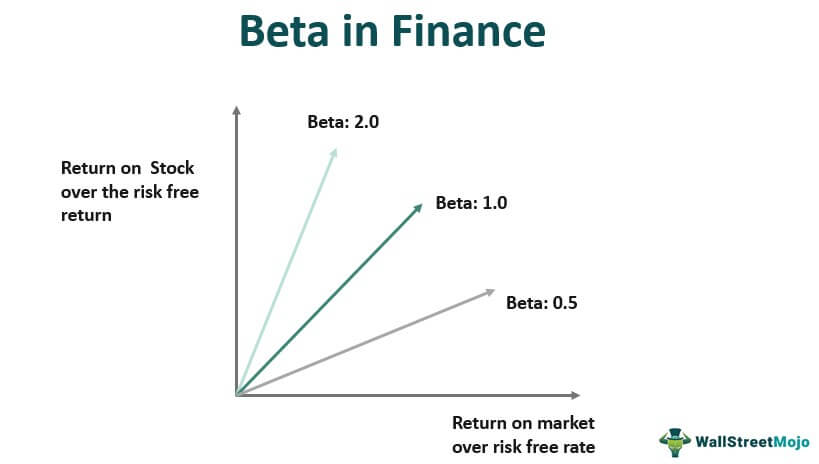
- If Beta = 1: If the stock’s Beta was equal to one, the stock has the same risk level as the stock market. If the market rises by 1%, the stock will also rise by 1%, and if the market comes down by 1%, the stock will also come down by 1%.
- If Beta > 1: If the Beta of the stock is greater than one, then it implies a higher level of risk and volatility than the stock market. Though the stock price change will be the same; however, the stock price movements will be rather extreme.
- If Beta >0 and Beta<1: If the stock’s Beta is less than one and greater than zero, it implies the stock prices will move with the overall market; however, the stock prices will remain less risky and volatile.
Beta In Finance Using Excel
Below are the steps used for calculating and understanding beta in finance using excel. It can be easily calculated using the excel slope function –
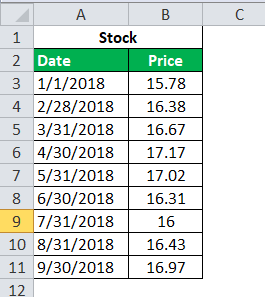
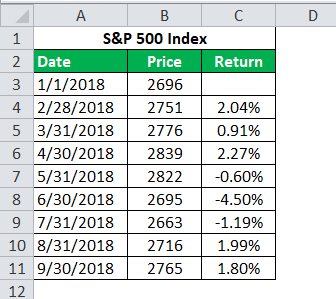
Step 1: Get the stock’s weekly/monthly/quarterly prices.
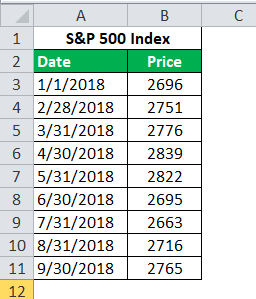
Step 2: Get the index’s weekly/monthly/quarterly prices.
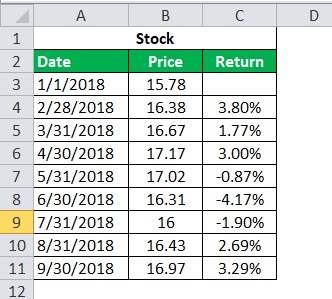
Step 3: Calculate the stock’s weekly/monthly/quarterly returns.
Step 4: Calculate the market’s weekly/monthly/quarterly returns.
Step 5: Use the slope function and select the return of the market and the stock
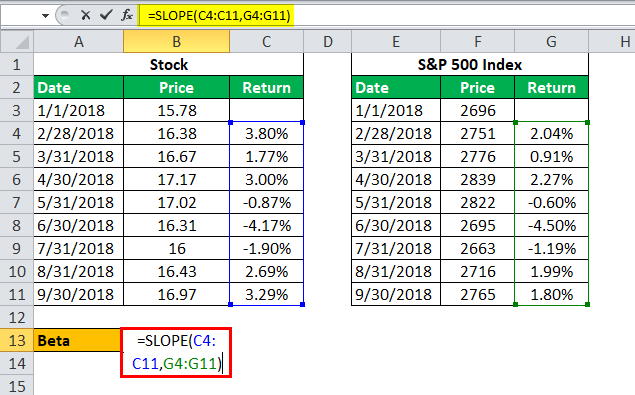
Step 6: The output of the slope is Beta
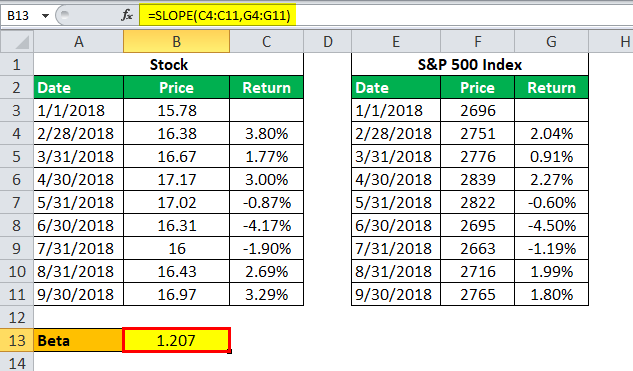
In the above example, we have calculated beta using the above steps. Return is calculated by dividing the old and new prices, subtracting one from it, and multiplying by a hundred.
These price returns are then used in calculating the slope function. In comparison to the market, the beta of the stock comes to 1.207. It means that the stock is more volatile than the market.
Advantages
Just as all financial concepts have their own advantages and disadvantages, so does this concept. Let us try to analyse the advantages first.
- Valuation: The most popular use of a beta is to calculate the cost of equity while conducting valuations. The CAPM uses beta to calculate the systematic risk of the market. In general, this can be used to value many companies with various capital structures.
- Volatility: Beta is a single measure that helps investors understand stock volatility compared to the market. It helps the portfolio managers assess the decisions regarding the addition and deletion of the security from his portfolio.
- Systematic Risk: Beta is a measure of systematic risk. Most of the portfolios have unsystematic risk eliminated from the portfolio. Beta only considers systematic risk and thereby provides the real picture of the portfolio.
Disadvantages
Here are some disadvantages of the concept.
- Understanding beta in finance can help to assess systematic risk. However, it does not guarantee future returns. Beta can be calculated at various frequencies, including two months, six months, five years, etc. Using the past data cannot hold for the future. It makes it difficult for the user to predict the stock’s future movements.
- Beta is calculated based on the stock prices compared to the market prices. Therefore, it isn’t easy for startups or private companies to calculate beta. Conclusion: there are methods like unleveraged beta and leveraged betas, which also require many assumptions.
- Another drawback is that beta cannot tell the difference between an upswing and a downswing. It does not tell us when the stock was more volatile.
It is necessary to clearly understand the positive and negative sides of any idea of concept so that they can be used in the optimum way to achieve the objective.
Beta In Finance Vs Alpha
Both the above are two different financial concepts that are widely used in the financial market by investors and analysts. But it is important to understand the differences between them.
- The former is a measure of systematic risk of the levels of fluctuations of an investment in relation to the overall market. But the latter measures the extra return that an investment ets with relation to the expected return.
- The former helps investors assess the sensitivity of a stock to the market volatility whereas the latter helps investors identify the ability of the fund manager to outperform the market return in their investment strategy.
- A beta greater than one indicates a high volatility level of the asset whereas the positive alpha indicates that the investment has outperformed the market.
Thus, both the beta and alpha are very valuable tools for investment performance evaluation and assessment of risk and are very often used together so as to obtain the maximum result.
Frequently Asked Questions (FAQs)
What is the importance of beta in finance?
Beta holds significant importance in finance as it helps investors assess and manage investment risk. Beta provides valuable insights into how an asset may perform in different market conditions by measuring a stock’s sensitivity to market movements. Investors use beta to construct diversified portfolios, as assets with different betas may react differently to market fluctuations.
What are the applications of beta?
Beta finds various applications in finance and investing. It is used to assess the risk of individual stocks and construct diversified portfolios to manage risk effectively. Beta is a vital component in the CAPM, which helps determine the expected return of an asset or portfolio based on its systematic risk. Investors also use beta to compare the risk profiles of different assets and evaluate their potential for generating returns.
What is beta vs. alpha?
Beta and alpha are both risk-adjusted performance measures used in finance. Beta measures a stock’s sensitivity to market movements, indicating its systematic risk. A beta greater than 1 implies higher volatility than the market, while a beta less than 1 suggests lower volatility. On the other hand, alpha measures an asset’s excess return above its expected return based on its beta. Positive alpha indicates outperformance, while negative alpha suggests underperformance.
Recommended Articles
This article has been a guide to what is Beta In Finance. We explain its formula & differences with alpha, how to calculate it with examples, interpretation. You may learn more about Corporate Finance from the following articles –