Table Of Contents
Capital Market Line (CML) Definition
The Capital Market Line is a graphical representation of all the portfolios that optimally combine risk and return. CML is a theoretical concept that gives optimal combinations of a risk-free asset and the market portfolio. The CML is superior to Efficient Frontier because it combines risky assets with risk-free assets.
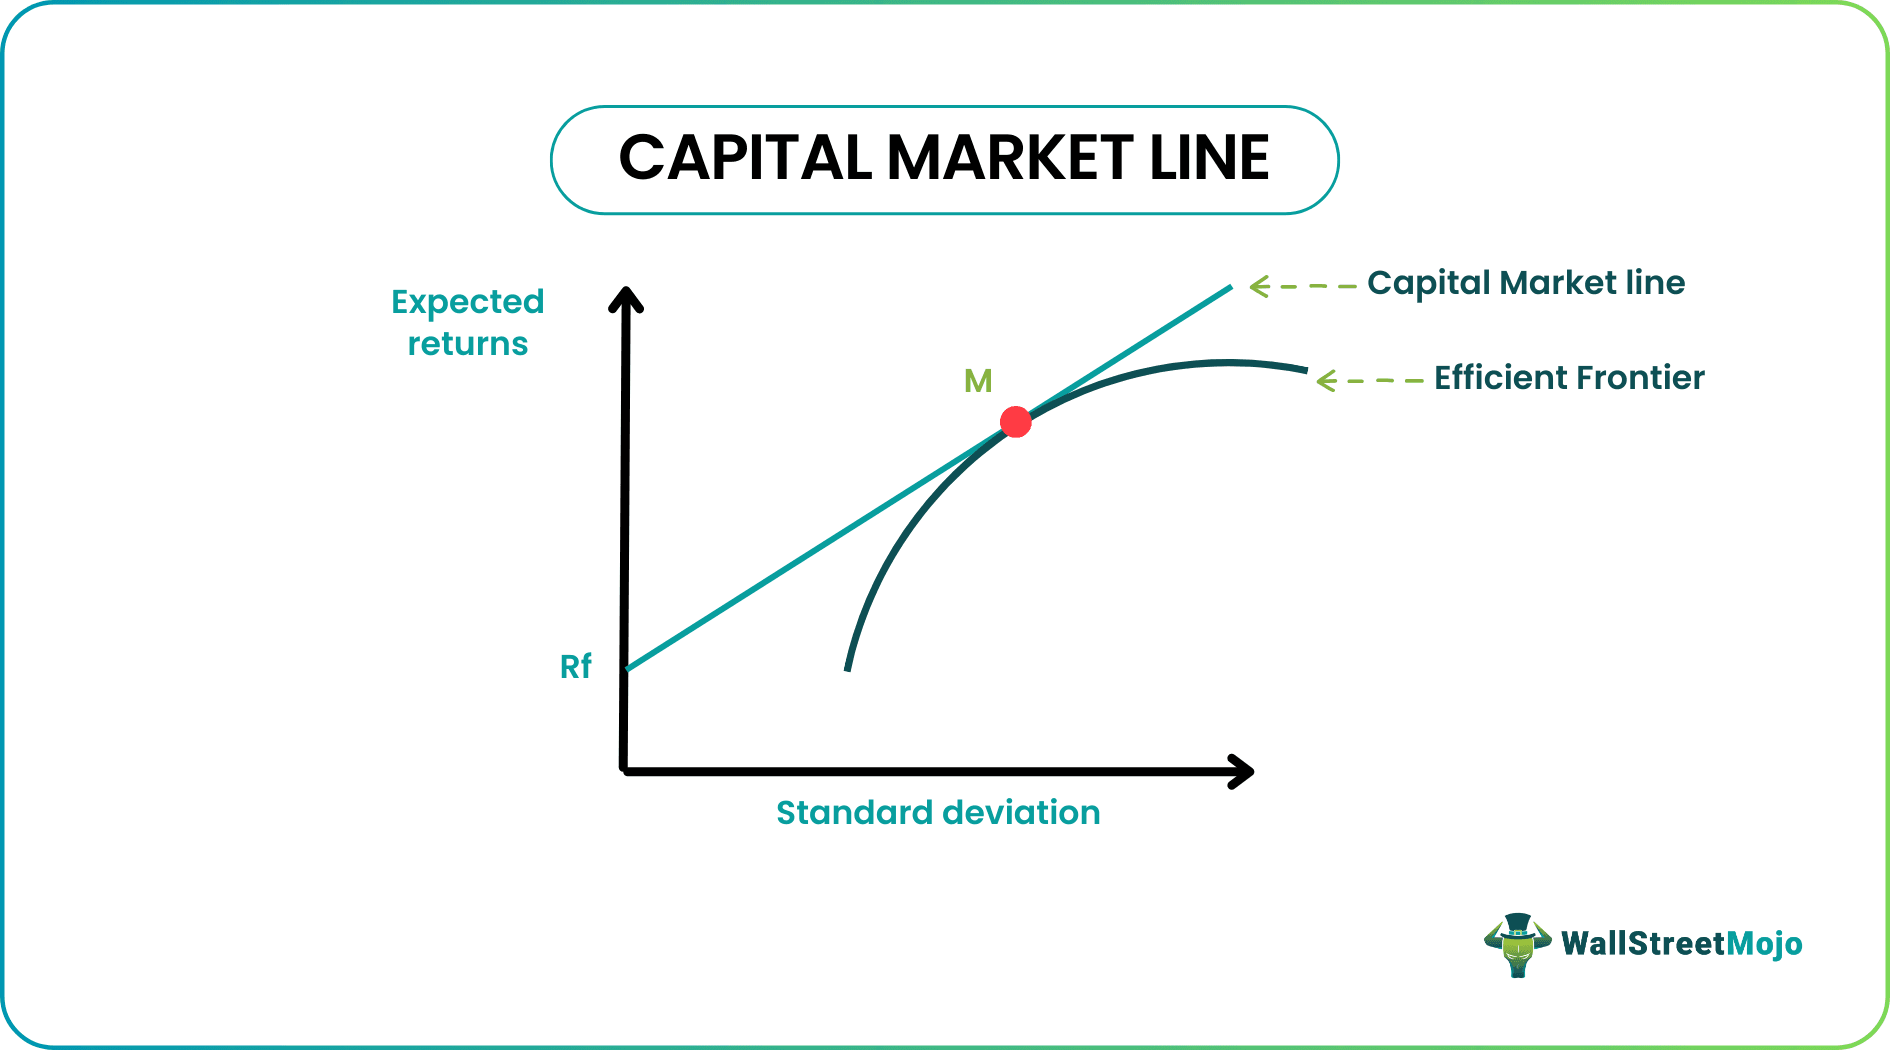
Analysts often use the capital market equation to derive the return amount that investors expect to take a certain amount of risk in the portfolio. The assumption for the CML is based on the assumptions of the capital market theory. But these assumptions often don't hold in the real world.
Key Takeaways
- The Capital Market Line (CML) illustrates an optimal equilibrium between risk and return by integrating a risk-free asset with the market portfolio. Its superiority over the Efficient Frontier lies in its inclusion of both risky and risk-free assets.
- The CML is determined using the Sharpe ratio of the market portfolio. A tangent line is drawn from the risk-free rate on the Efficient Frontier. Progressing upwards amplifies both risk and return while descending yields the converse effect.
- Investors and investment managers commonly employ diverse models rooted in this theory to evaluate the market's potential returns and associated risks.
Capital Market Line Explained
The Capital Market Line (CML) draws its basis from the capital market theory and the capital asset pricing model. It is a theoretical representation of different combinations of a risk-free asset and a market portfolio for a given Sharpe Ratio.
It is superior to the efficient frontier because it only consists of risky assets/market portfolios. The CML combines this market portfolio with this market portfolio. As we move up along the capital market line, the risk in the portfolio increases, and so does the expected return. If we move down along the CML, the risk decreases, as does the expected return. We can use the capital market line graph to find the expected return for any portfolio given its standard deviation.
The slope of the Capital Market Line(CML) is the Sharpe Ratio of the market portfolio.
The efficient frontier represents combinations of risky assets.
If we draw a line from the risk-free rate of return, which is tangential to the efficient frontier, we get the Capital Market Line. The point of tangency is the most efficient portfolio. ·
Moving up the CML will increase the portfolio's risk, and moving down will decrease the risk. Subsequently, the return expectation will also increase or decrease, respectively.
All investors will choose the same market portfolio, given a specific mix of assets and the associated risk.
This line is a statistical approach toward explaining the relationship between risk and return expected for a company. This, in turn, helps individuals and entities know the performance and worth of the company. If you want to learn more about such techniques to evaluate a company's value, this Valuation Course can help you.
Money Market and Capital Market Video Explanation
Line Formula
The capital market line graph can be plotted using the formula can be written as follows:
ERp = Rf + SDp * (ERm - Rf) /SDm
Where,
- Expected Return of Portfolio
- Risk-Free Rate
- Standard Deviation of Portfolio
- Expected Return of the Market
- Standard Deviation of Market
We can find the expected return for any level of risk by plugging the numbers into this equation.
How To Calculate?
To calculate the capital market line equation, the step-by-step process given below.
- Determine Risk-Free Rate: Identify the prevailing risk-free rate, which is typically the yield of a government bond or a similarly low-risk investment. This rate represents the return available with zero risk.
- Select Risky Assets: Choose a set of risky assets that will constitute your portfolio. These could be stocks, bonds, or other investment options.
- Calculate Portfolio Expected Returns and Standard Deviations: Calculate the expected return and standard deviation of each portfolio by combining the risk-free asset and different proportions of the risky assets. This generates a range of portfolios with varying risk-return profiles.
- Plot the Efficient Frontier: Plot the combinations of risky assets and risk-free assets on a graph, with the x-axis representing standard deviation (risk) and the y-axis representing expected return. These points will create the efficient frontier, a curve showing the optimal portfolios for different risk levels.
- Draw the Capital Market Line: The Capital Market Line is a tangent line drawn from the risk-free rate to the efficient frontier. The tangent point represents the optimal risky portfolio that balances risk and return. The slope of the CML is the Sharpe ratio, which measures the excess return per unit of risk.
- Interpolate the CML: You can then interpolate points along the CML to find the expected return for any given level of risk. These interpolated points provide a guideline for constructing a diversified portfolio that balances risky assets and risk-free assets.
Example
Now that we understand the basics of the concept, formula, and how to calculate a capital market line equation, let us apply the theoretical knowledge into practical application through the example below.
Suppose the current risk-free rate is 5%, and the expected market return is 18%. The standard deviation of the market portfolio is 10%.
Now let’s take two portfolios with different Standard Deviations:
- Portfolio A = 5%
- Portfolio B = 15%
Using the Capital Market Line Formula,
Calculation of Expected Return of Portfolio A
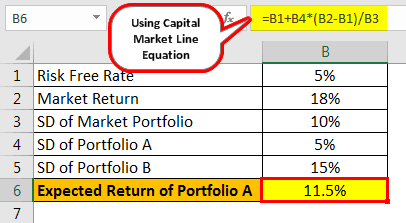
- = 5% +5%* (18%-5%)/10%
- ER(A) = 11.5%
Calculation of Expected Return of Portfolio B
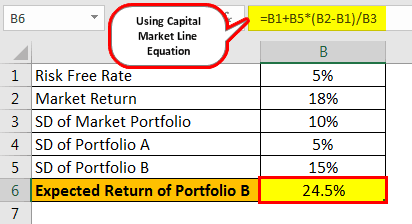
- = 5% +15% (18%-5%)/10%
- ER(B) = 24.5%
The capital market line represents different combinations of assets for a specific Sharpe ratio. As we increase the risk in the portfolio (moving up along the Capital Market Line), the expected return increases. The same is true vice-versa. But the excess return per unit of risk, which is the Sharpe ratio, remains the same.
CML Theory
Capital Market Theory tries to explain the movement of the Capital Markets over time using one of the many mathematical models. The most commonly used model in Capital Market Theory is the Capital Asset Pricing Model.
Capital Market Theory seeks to price the assets in the market. Investors or Investment Managers trying to measure the risk and future returns in the market often employ several of the models under this theory.
Assumptions
There are certain assumptions in the Capital Market Theory equation that hold for the CML.
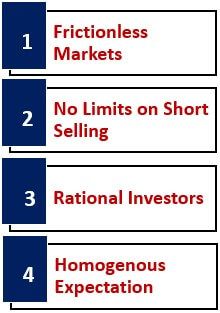
- Frictionless Markets – The theory assumes the existence of frictionless markets. It assumes that investors can smoothly conduct transactions in the market without incurring any additional costs. There are no transaction costs or taxes applicable to such transactions.
- No Limits on Short Selling – Short selling is when you borrow securities and sell them with an expectation of their price going down. Capital Market Theory assumes that there are no limits on using the funds received from short selling.
- Rational Investors – The Capital Market Theory assumes that investors are rational, and they decide after assessing risk-return. It assumes that the investors are informed and make decisions after careful analysis. ·
- Homogeneous Expectation – Investors have the same expectations of future returns in their portfolios. Given the three basic inputs of the portfolio model for calculating future returns, all investors will come up with the same efficient frontier. Since the risk-free asset remains the same, the tangency point representing the Market Portfolio will be the obvious choice for all investors
Limitations
Let us understand the limitations of the points on a capital market line graph through the points below.
- Assumptions – Certain assumptions exist within the concept of the Capital Market Line. However, these assumptions are often violated in the real world. For example, the markets are not frictionless. There are certain costs associated with the transactions. Also, investors are usually not rational. They often make decisions based on sentiments and emotions.
- Borrowing/Lending at Risk-Free Rate – Theoretically, it is supposed that investors can borrow and lend without any limits at the risk-free rate. However, in the real world, investors usually borrow at a higher rate than the rate at which they can lend. It increases the risk or standard deviation of a leveraged portfolio.
Capital Market Line Vs Security Market Line
The Capital Market Line (CML) and the Security Market Line (SML) are two important concepts in finance that help investors understand the relationship between risk and return within the context of their investment decisions. While they share similarities, they have distinct differences that we can learn through the comparison below.
Capital Market Line
- The Capital Market Line is a graphical representation that shows the relationship between risk and return for a portfolio that includes both risky assets and risk-free assets.
- The CML is derived from the efficient frontier, which represents a range of optimal portfolios with different risk-return trade-offs.
- The CML is a tangent line drawn from the risk-free rate to the efficient frontier. It helps investors determine the optimal combination of risky and risk-free assets to achieve the best risk-adjusted return.
- The slope of the CML is the Sharpe ratio, which measures the excess return per unit of risk.
Security Market Line
- The Security Market Line is another graphical representation that illustrates the relationship between the expected return and the systematic risk (beta) of individual securities or portfolios.
- The SML is derived from the Capital Asset Pricing Model (CAPM), which quantifies the expected return of an asset based on its risk as measured by beta.
- The SML is a straight line that starts from the risk-free rate and has a positive slope equal to the market risk premium (the excess return of the market over the risk-free rate) multiplied by beta.
- Assets or portfolios that lie above the SML are considered underpriced (good investments), while those below are considered overpriced.

