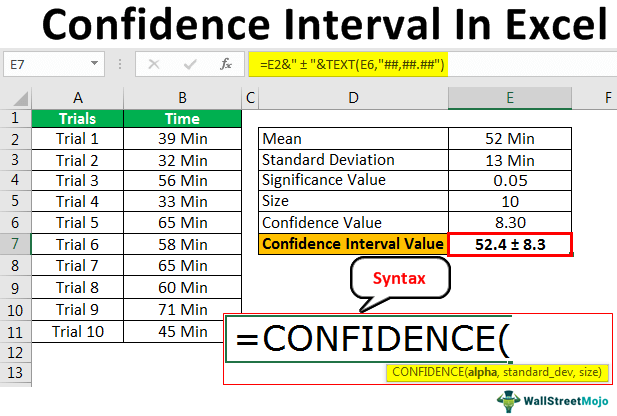
What is Confidence Interval in Excel?
Confidence Interval in excel is the range of population values that our true values lie in. This takes the CONFIDENCE value, centered around the population mean of the range of values. So, by calculating the CONFIDENCE value, we can easily construct the confidence interval value around the average mean of the sample values.
CONFIDENCE is a statistical function in excel that uses the mean value of the sample data, a standard deviation of the sample, and the number of samples to calculate the confidence value to construct the confidence interval value.
Syntax
Below is the syntax of the CONFIDENCE function.
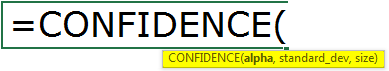
- Alpha: This is the sign which is at 1 confidence level; if 90% is the confidence level, then significance level 0.10.
- Standard Deviation: This is the SD of the data range.
- Size: The number of observations in the data set.
To compare the confidence interval value, we need to calculate the data set’s mean further. But, first, we will see some of the examples to understand practically.
How to Calculate & Find Confidence Interval in Excel?
Below is an example of calculating the confidence interval in excel.
One of the food delivery companies surveyed delivered the food to the customer on numerous occasions. They recorded the time taken to deliver the food to the customer.
Solution
Below is the sample data of the same.
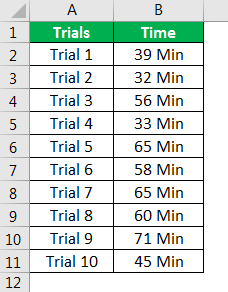
From the above data, we need to solve the confidence interval time to deliver the food quickly.
Follow the below steps to calculate the confidence value.
Copy the above data to the excel worksheet first.

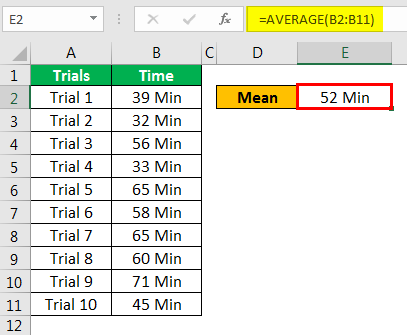
From the above data, we need to calculate certain values essential for the CONFIDENCE function in excel. So, the first thing we need to calculate is the MEAN value. Then, calculate the mean value using the AVERAGE in the excel function.

So, the average time to deliver the food on ten occasions is 52 Minutes.Calculate the Standard Deviation of the data set by using the STDEV.P function.

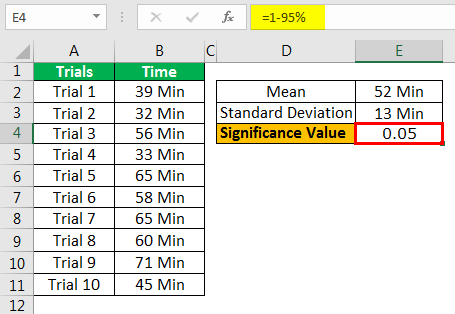
Now, we need to note down the confidence level of the food delivery company to commit themselves to delivering the food quickly. They are committing at a 95% confidence level; then, we need to calculate the significance value.
Significance value will be 1 – Confidence Value = 5% i.e. 0.05
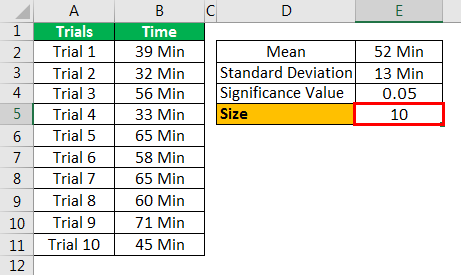
The final part we need to note down is what is the number of occasions the experiment has been conducted, in this case, ten times.

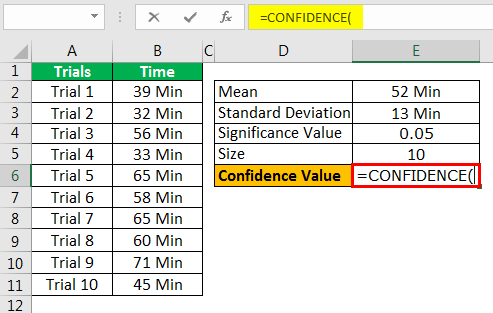
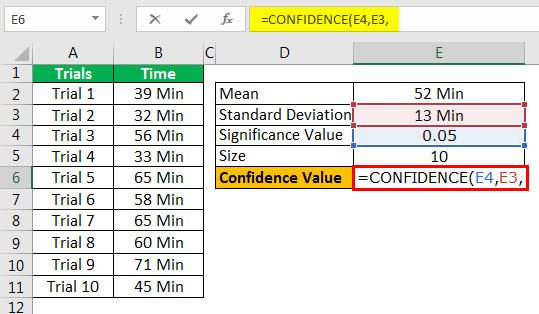
Using these values, we will calculate the CONFIDENCE value.Open CONFIDENCE function in E6 cell.

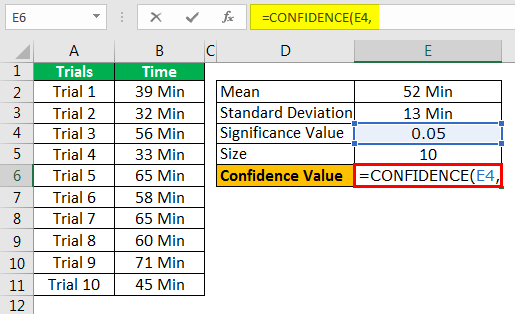
The first argument of this function is Alpha, i.e., what is the significance value. So our significance value is 0.05, which is there in cell E4.

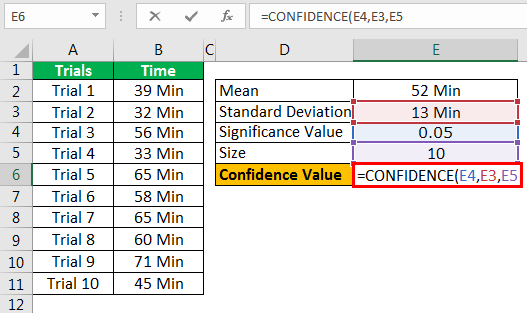
Next up is the Standard Deviation of the sample data. We have already calculated this SD in cell E3, so give the cell reference.

The final argument of the CONFIDENCE function is Size, i.e., the number of experiments conducted, so give the cell reference as E5 cell.

Ok, that’s all. Close the bracket and hit the enter key to get the confidence value.


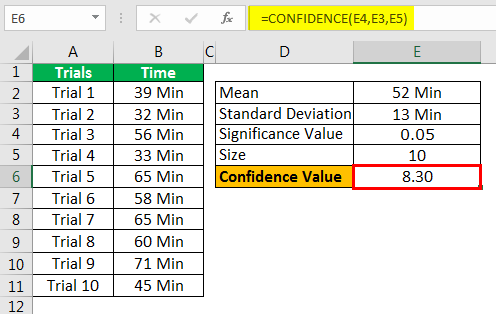
So, the confidence value of the data series is 8.30; using this, we can construct a confidence interval value.
The Confidence Interval value is arrived at by adding and subtracting the confidence value from the data set’s MEAN.
So, Confidence Interval (CI) = MEAN ± Confidence Value.
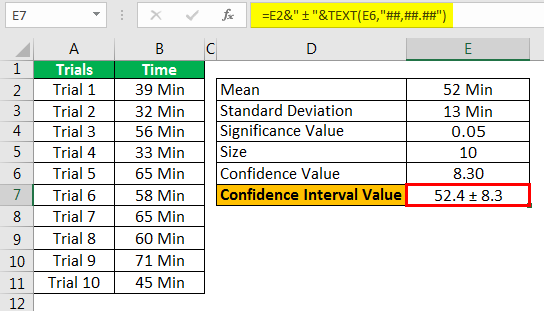
- CI = 52 ± 8.30
- CI = 52 + 8.30 or 52 – 8.30
- CI = 44.10 to 60.70.
Things to Remember Here
- Confidence Interval in Excel is the plus or minus value of the data set’s average and the confidence value.
- The confidence function accepts only numerical values.
- The CONFIDENCE function in excel has been upgraded to CONFIDENCE in recent versions.NORM & CONFIDENCE.T functions.
Recommended Articles
This has been a guide to Confidence Interval In Excel. Here we discuss how to calculate confidence interval values in excel using the confidence function with examples and downloadable excel templates. You may also look at these useful functions in excel –