Part of our Statistical Functions in Excel guide
What Is Weibull Distribution In Excel?
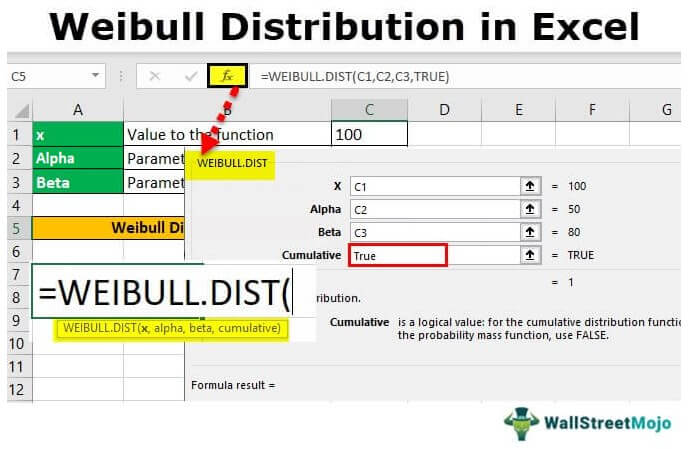
The Weibull distribution in Excel is widely used in statistics that helps us calculate the average failure time of a piece of equipment in the process of production, and predict the failure occurrences for a time period, such as quarterly, half-yearly, or yearly.
The Excel Weibull Distribution’s original formula is complex. However, we have a built-in function known as Weibull.Dist function to insert from the “Function Library”.
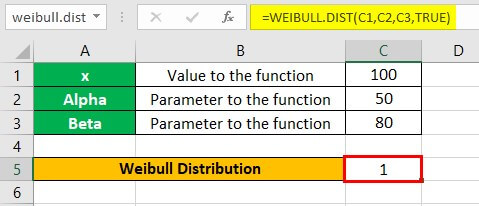
For example, with the provided or assumed values, we can calculate the Weibull distribution, as shown in the image below.
Key Takeaways
- The Weibull Distribution in Excel helps us estimate the analyzed data based on the mean failure prediction.
- We use the inbuilt Weibull.Dist() statistical function available in Excel to calculate the same, instead of the original formula, as it is complex to use and understand.
- To enter the argument values for the function, we must take note of a few things, such as all values must be numeric, the x value must be greater than zero, alpha & beta greater than or equal to Zero.
- We can use this feature to find the warranty cost of a product, or to predict the warranty period based on the analyzed failure rate.
Weibull Distribution() Excel Formula
The syntax of the Weibull Distribution() Excel Formula is,
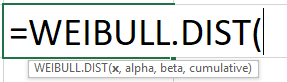
The arguments of the Weibull Distribution() Excel Formula are,
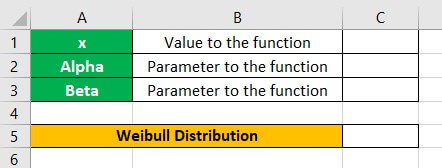
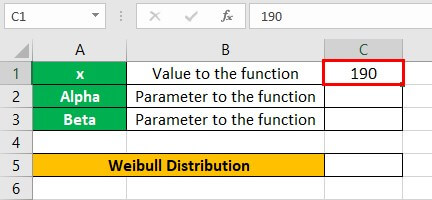
- X is a value to the function.
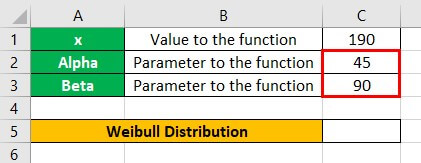
- Alpha is a parameter to the function.
- Beta is also a parameter to the function.
- Cumulative is a logical argument that can be either true or false, depending upon the type of Weibull distribution function we are trying to use. For example, if we use the Weibull cumulative distribution function, the cumulative value will be “True”, or if the Weibull probability density function, then the cumulative value will be “False”.
Types Of Weibull Distribution Excel Function
The Weibull distribution is a continuous probability distribution, and is of two types, namely:
- Weibull Cumulative Distribution Function.
- Weibull Probability Density Function.
The only difference between the two types of Weibull distribution is the cumulative logical argument,
- The Weibull cumulative distribution function takes “True” as a cumulative argument.
- The Weibull probability density function takes “False” as a cumulative argument.
How To Use Weibull Distribution In Excel?
We will consider some examples of using the Weibull Distribution In Excel.
Example #1
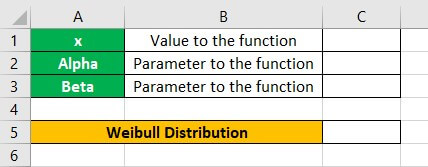
X is valued at which we evaluate the function, alpha, and beta. That is because both are the parameters of the function.
The steps to calculate the Weibull Distribution are,
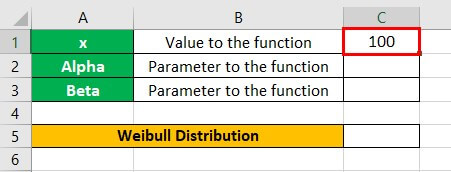
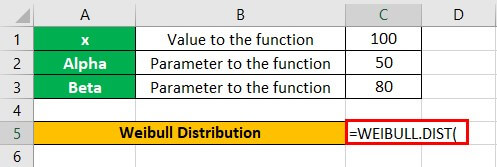
Give value to the WEIBULL.DIST function, for example, 100

Now, let us give the parameter to the function, i.e., Alpha and Beta.

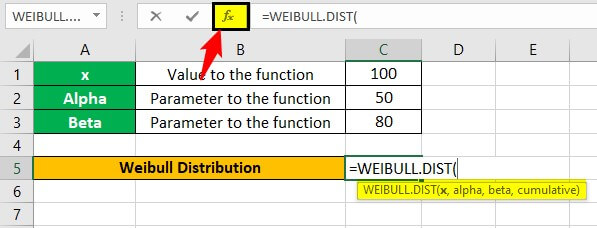
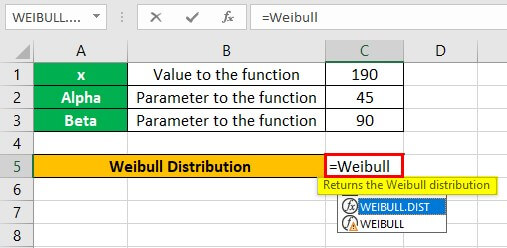
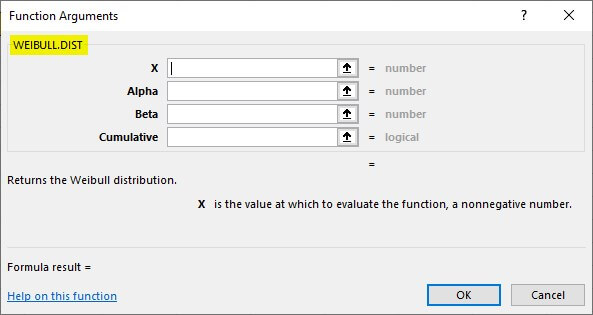
In the “Weibull Distribution Box”, Type:

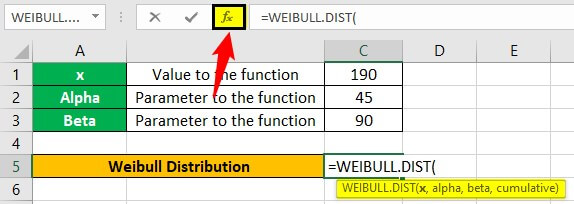
Then, press the Tab key, and click the “fx” function button.

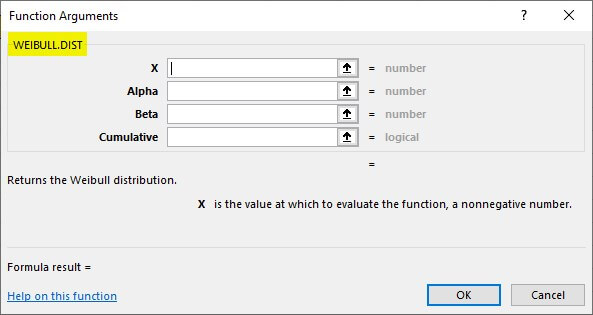
A dialog box pops up.

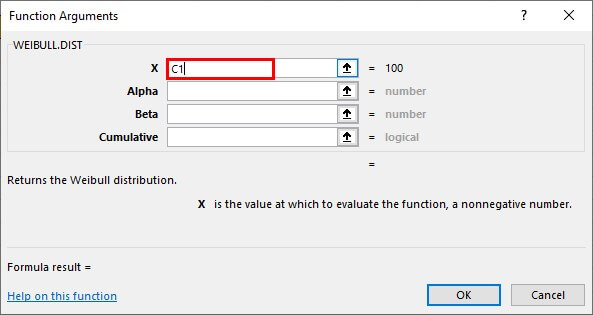
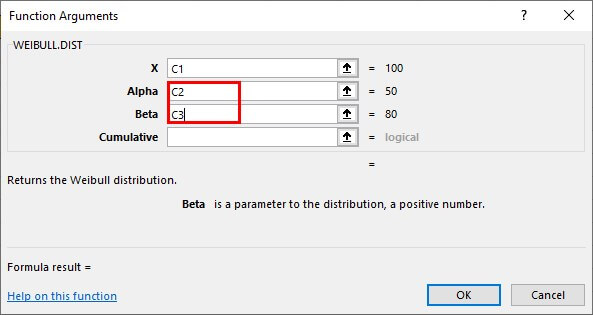
In the box for “X,” select the value against the value of the function.
For the function’s parameter, select the Alpha and Beta values.
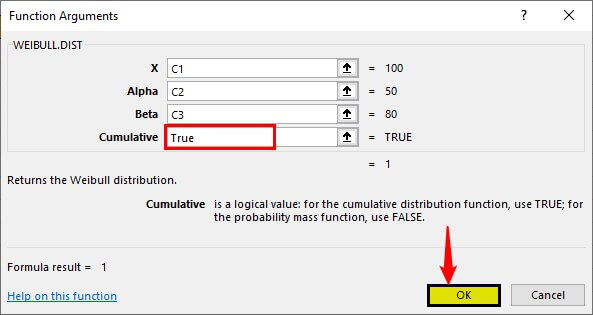
Cumulative is a logical value that can be either “True” or “False”, Both have different meanings. So, let us insert “True” first.
Click “OK”. We get the result for Weibull distribution.

The above value calculation Weibull’s cumulative distribution. For this, the cumulative value should be “True”.

Example #2
We have seen that inserting “True” in the cumulative value gives us Weibull’s cumulative distributive value. On the other hand, if we insert “False” at the cumulative, it gives us the Weibull probability density value. Let us go with the first example.
We have seen that X is valued at which we evaluate the function. Alpha and Beta are both the parameters of the function. Let us again use this function in Excel.
The steps to calculate the Weibull Distribution are,
- Step #1 – We will again give a value to the function, i.e., 190, for this case.
- Step #2 – Now, we give a parameter to the function: Alpha and Beta.
- Step#3 – Now, in the “Weibull distribution box” type:
- Step#4 – Press the Tab key, and click the “fx” function bar.
- Step#5 – A dialog box appears for the “Function Arguments”.
- Step#6 – Now, we will give the functions and the parameters’ values: Alpha and Beta.

- Step#7 – Previously, we inserted “True” as the value in cumulative. Now, we will insert “False” as a value in the cumulative logical value.
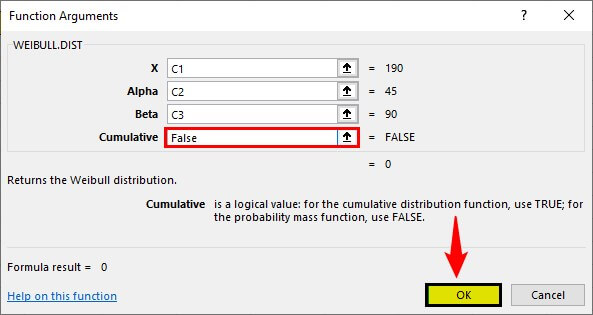
- Step#8 – Click “OK”. We will get our desired value.
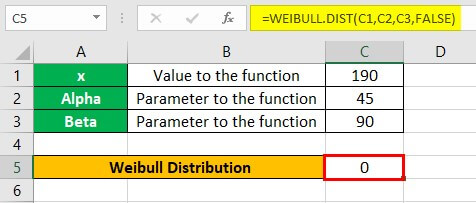
The value above calculated is Weibull probability density.
Important Things To Note
- X, a value to the function, must always be a positive number, not a zero, but always greater than zero. We get the #NUM! error when the value of x is less than zero.
- Alpha and beta, the function parameters, must also be equal to or greater than zero.
- We get two types of errors in Excel Weibull Distribution.
- We get the #Value! error if any arguments given are non-numeric.
Frequently Asked Questions (FAQs)
Where is the Weibull Distribution in Excel found?
The Weibull Distribution function is found as follows:
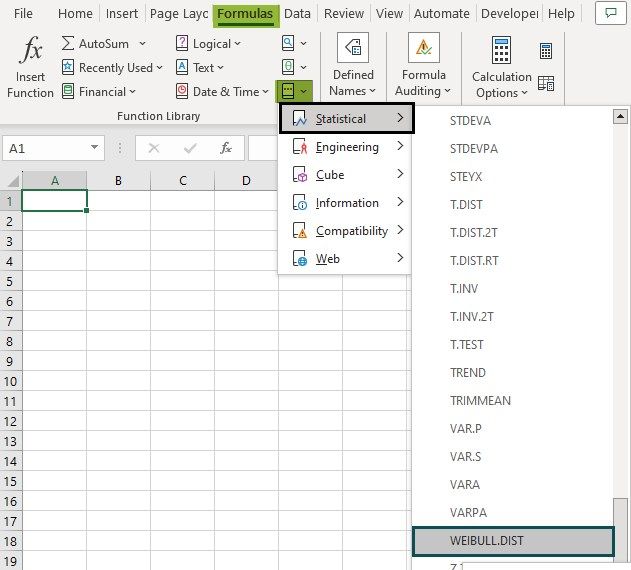
First, choose an empty cell – select the “Formulas” tab – go to the “Function Library” group – click the “More Functions” option drop-down – click the “Statistical” option right-arrow – select the “Weibull.Dist” function, as shown below.
Where does the Weibull Distribution in Excel find its application?
The Weibull Distribution in Excel is used as follows:
- Engineering companies use Weibull Analysis to determine the risk of a failure of a product or a component. With the risk data, they can estimate the cost involved at the time or over the time of purchase and align the warranty costs or the corresponding warranty period.
- It is a continuous probability distribution used to analyze real-life data, model failure times, and assess product reliability. Due to which, it fits a huge range of data from many other fields like economics, hydrology, biology, and engineering sciences.
- It models a broad range of random variables, mostly in the nature of a time to failure or time between events. For example, we can estimate the maximum one-day rainfall, the time a user spends on a web page, the warranty cost of a product, etc.
Why is the Weibull Distribution in Excel not working?
A few reasons the Weibull Distribution in Excel may not work are,
- The value of X is a negative number or less than zero.
- One of the entered arguments is a non-numeric value. The argument values must always be numeric.
Recommended Articles
This article has been a guide to Weibull distribution in Excel. Here we use WEIBULL.DIST to find mean risk of product failure, examples, downloadable Excel template. You may learn more about Excel from the following articles: –