Chi-Square Test in Excel
The chi-square test is a non-parametric test that compares two or more variables from randomly selected data. It helps find the relationship between two or more variables. In Excel, we calculate the chi-square p-value. Since Excel does not have an inbuilt function, mathematical formulas are used to perform the chi-square test.
There are two types of chi-square tests which are listed as follows:
- Chi-square goodness of fit test
- Chi-square test for independence
Key Takeaways
- The chi-square test is a non-parametric test that compares two or more variables from randomly selected data.
- The chi-square goodness of fit test helps determine whether the sample data matches the population or not.
- The chi-square test for independence helps determine whether the variables are independent of one another or not.
- Two random variables are said to be independent if the probability distribution of one variable is not affected by the other.
- The symbol of the chi-square test is “x2” (i.e., “x” raised to the power 2).
- If the chi-square calculated value is greater than the chi-square critical value, the null hypothesis (H0) is rejected.
- If the chi-square p-value is less than or equal to the significance level (α), the null hypothesis is rejected.
#1 – Chi-Square Goodness of Fit Test
The goodness of fit test helps determine whether the sample data matches the population or not. In other words, it shows how well the sample data fits a set of observations.
The symbol of the chi-square test is “x2” (i.e., “x” raised to the power 2). “x2” is the summation of the (observed count–expected count)2/expected count.
The formula of the chi-square goodness of fit test is given as follows:
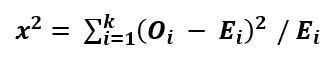
Where,
- “x2” is the chi-square statistic
- “Oi” is the observed frequency
- “Ei” is the expected frequency
- “i” is the “ith” position in the contingency table
- “k” is the category
- Degrees of freedom (df)=k-1
The Uses of the Goodness of Fit Test
The test is used in the following situations:
- To evaluate the creditworthiness of borrowers based on their age group and history of debt obligations
- To establish a relation between the performance of sales representatives and the training received by them
- To compare the returns of a single stock with the returns on stocks of the whole sector
- To evaluate the impact of a television campaign on a category of viewers
#2 – Chi-Square Test for Independence
It helps determine whether the variables are independent of one another or not. Two random variables are called independent if the probability distribution of one variable is not affected by the other.
The formula of the chi-square test for independence is given as follows:
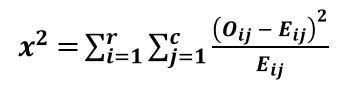
Where,
- “x2” is the chi-square statistic
- “Oij” is the observed frequency in the ith row and jth column
- “Eij”is the expected frequency in the ith row and jth column
- “r” is the number of rows
- “c” is the number of columns
- Degrees of freedom (df)=(r-1)(c-1)
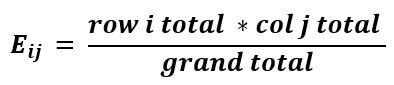
The formula for calculating the expected frequency in the ith row and jth column is given as follows:
The Uses of the Chi-Square Test for Independence
The test is used in the following situations:
- There are two categorical variables and the relation between them is to be determined.
- There are cross-tabulations (two-way tables) and the relationship between various categorical variables needs to be studied.
- There are non-quantifiable variables. For example, one needs to determine the reason behind variations of health plans across age groups.
The Characteristics of the Chi-Square Test
The features of the chi-square test are listed as follows:
- It evaluates whether observed frequencies vary significantly from the expected frequencies under a given set of assumptions.
- It determines how well an assumed distribution fits the data.
- It uses the contingency tables (or crosstabs) to summarize the relationship between various categorical variables.
- It supports nominal level measurements.
Note: In the simplest form, the chi-square distribution is the square of the standard normal distribution.
How to Perform the Chi-Square Test in Excel? (With Example)
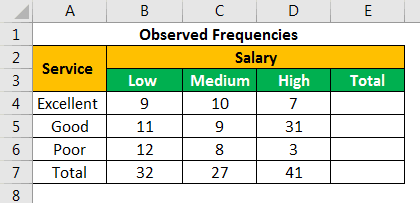
A restaurant manager wants to find the relationship between quality of service and the salary of customers waiting to be served.
She organizes the task in the following way:
- A random sample of 100 customers is considered.
- Every customer is asked to rate the service of the restaurant as “excellent,” “good,” and “poor.”
She constructs the following hypothesis:
- Null hypothesis (H0)–The quality of service is not dependent on the salary of customers waiting to be served.
- Alternative hypothesis (H1)–The quality of service is dependent on the salary of customers waiting to be served.
The manager divides the customers into three categories based on their salaries–“low,” “medium,” and “high.” The level of significance (α) is 0.05.
The findings are presented as nine data points shown in the following table.
Let us calculate the sum of all the rows and columns. We apply the following SUM formula to add the numbers of the fourth row.
“=SUM(B4:D4)”
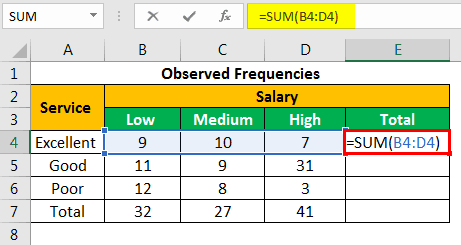
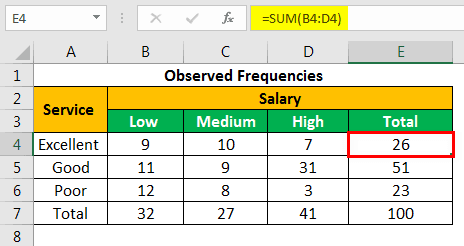
Press the “Enter” key and the sum appears in cell E4. The output is 26.
Similarly, we apply the SUM formula to the remaining rows and columns. There are 27 respondents with medium salary and 51 respondents who rated the service quality as “good.”
We apply the formula “(r-1)(c-1)” to calculate the degrees of freedom (df).
df=(3-1)(3-1)=2*2=4
We apply the following formula to calculate the expected frequency for column B and row 4.
“(=B7*E4/B9)”
The calculation is shown in the following image.
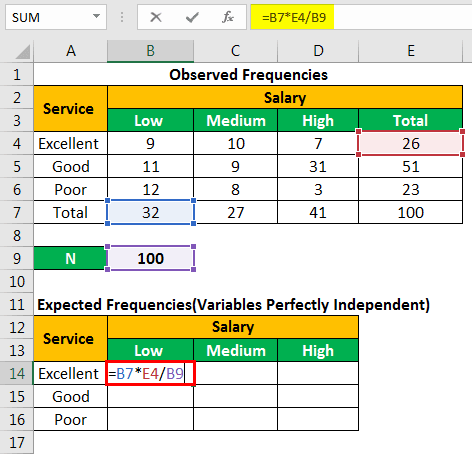
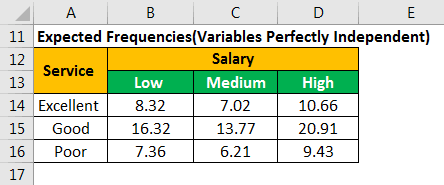
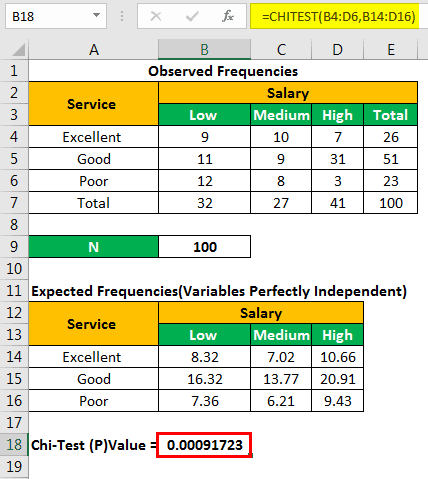
The expected number of customers who have “low” salary but rated the restaurant service as “excellent” is 8.32.
In the following calculations, E11 is the expected frequency of the first row and the first column. E12 is the expected frequency of the first row and the second column.
- E11=(26*32)/100=8.32, E12=7.02, E13=10.66
- E21=16.32, E22=13.77, E23=20.91
- E31=7.36, E32=6.21, E33=9.43
Similarly, we calculate the expected frequencies for the entire table, as shown in the succeeding image.
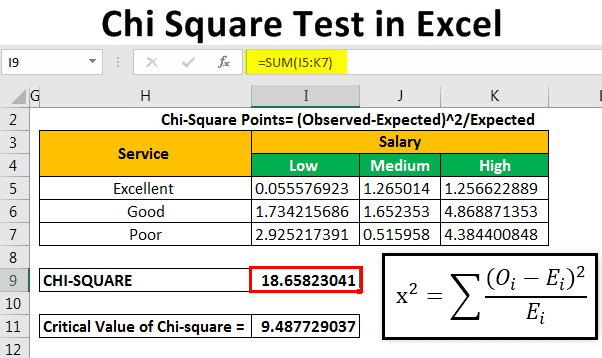
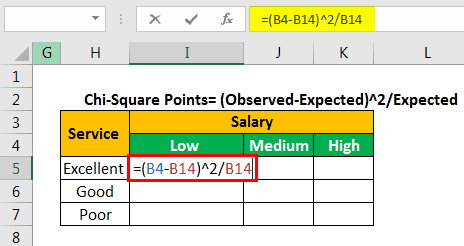
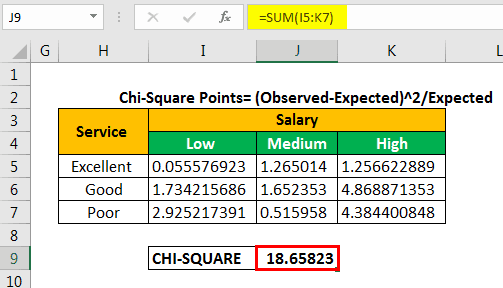
Let us calculate the chi-square data points by using the following formula.
Chi-square points=(observed-expected)^2/expected
We apply the formula “=(B4-B14)^2/B14” to calculate the first chi-square point.
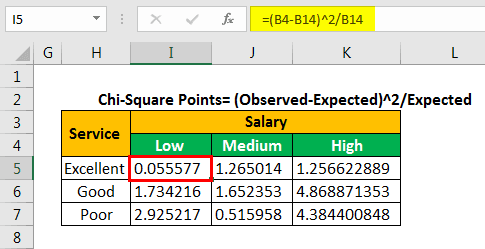
We copy and paste the formula to the remaining cells. This is done to fill values in the entire table, as shown in the following image.
Let us calculate the chi-square calculated value by adding all the values given in the succeeding table.
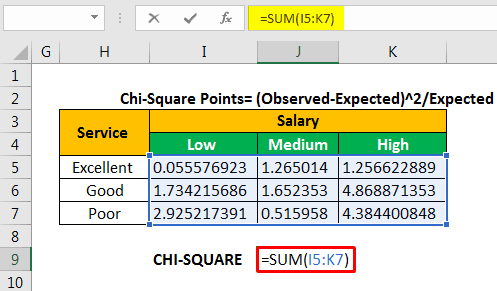
The chi-square calculated value is 18.65823.
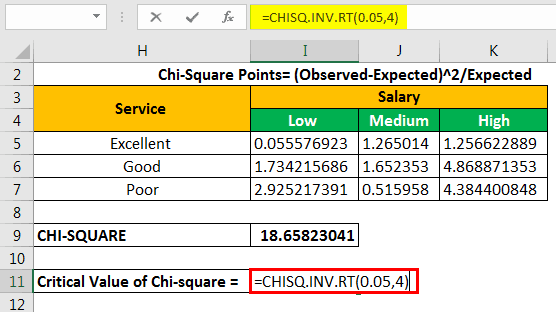
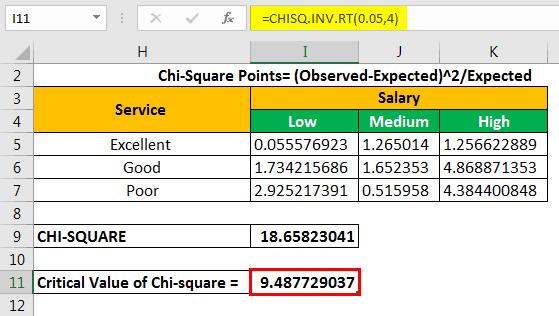
To calculate the critical value, we use either the chi-square critical value table or the CHISQ formula. The formula “CHISQ.INV.RT” contains two parameters–the probability and the degrees of freedom.
The probability is 0.05, which is a significant value. The df is equal to 4.
The chi-square critical value is 9.487729037.
Let us find the chi-square p-value with the help of the following formula.
“=CHITEST(actual_range,expected_range)”
We apply the formula “=CHITEST(B4:D6,B14:D16).”
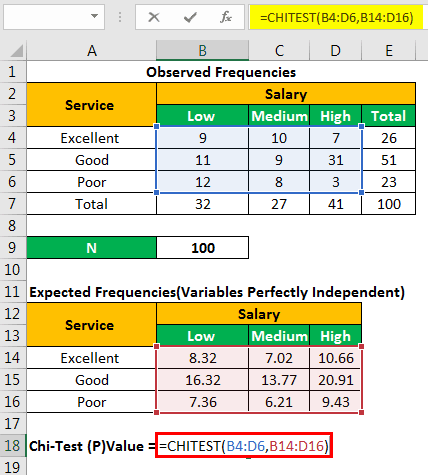
The chi-square p-value is= 0.00091723.
The chi-square calculated value is significant when equal to or more than the chi-square critical value (tabulated value). The null hypothesis (H0) is rejected if the chi-square calculated value is greater than the chi-square critical value.
Here x2 (calculated)>x2 (tabulated) or 18.65>9.48. Hence, we reject the null hypothesis and accept the alternative hypothesis.
The p-value can also determine whether the null hypothesis must be accepted or rejected. For this, the p-value is compared with alpha (α) in the following way:
- If p-value <= α, the null hypothesis is rejected.
- If p-value > α, the null hypothesis is accepted.
In this example, p-value<α or 0.0009172<0.05. So, we reject H0 and accept H1.
We conclude that the quality of service is dependent on the salary of customers waiting to be served.
Frequently Asked Questions (FAQs)
How should the chi-square test be interpreted?
The “x2” in the goodness of fit test determines how well the sample data matches the characteristics of the larger population. If the sample data does not match the expected properties of the population, this sample is not used for drawing conclusions related to the larger population.
The “x2” in the chi-square test for independence determines how likely the difference between actual and expected frequencies can be explained by random chance. This difference may or may not have been caused by a sampling error.
What is the p-value in a chi-square test?
The p-value, calculated in a chi-square test, represents an area in the tail of a probability distribution curve. A p-value is a number between zero and one. It is expressed in decimals.
For example, a p-value of 0.0254 implies a 2.54% probability that the results could have happened by chance. The smaller the p-value, the more important (significant) the results are. A significant result is one where the null hypothesis is rejected.
Which chi-square test should be used in Excel?
The chi-square statistic to be used depends on how the data has been collected and which hypothesis is being tested.
The goodness of fit test is used when there is one categorical variable. It is also used when there is a need to determine the consistency between the sample data and the hypothesized distribution.
On the other hand, the chi-square test for independence is used when there is a need to study the relationship between two categorical variables.
Recommended Articles
This has been a guide to Chi-Square Test in Excel. Here we learn how to perform the chi-square test along with step by step examples. Below are some useful Excel articles-