Part of our Statistical Functions in Excel guide
What Is VAR.P Excel Function?
The VAR.P function in Microsoft Excel is a statistical tool used to calculate the population variance of a given dataset. It enables professionals to assess the variation or spread of data points relative to their mean value by providing a measure of dispersion. By using this function, Excel performs the calculations automatically, saving time and ensuring accuracy. VAR.P takes an array or range of values as its argument and returns the variance of the entire population.
VAR.P Excel Template
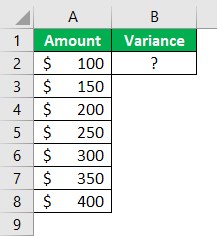
Download Excel TemplateFor example, we have been given the amount as shown below:
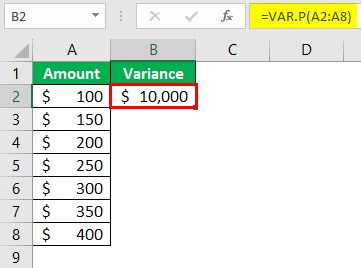
To determine the variance, utilize the following formula: =VAR.P(A2:A8)
The resulting outcomes are as follows:
- VAR.P function in excel empowers users to evaluate trends over time, identify outliers, determine performance thresholds, and make sound predictions by statistically evaluating risk factors within complex datasets.
- The data is continuous or discrete does not matter; the VAR.P function can handle both input types efficiently.
- The analysts and professionals can utilize the VAR.P function confidently whenever they need to calculate variance from their numerical datasets, regardless of their nature or source.
- The VAR.P function assumes that the provided data represents the entire population.
Syntax

The VAR.P function is equipped with the following arguments:
- Number 1 – This is a required argument. This parameter corresponds to the initial argument pertaining to a population.
- Number 2 – This is an optional argument. Within this context, the number of arguments can encompass a maximum of 254 values or arrays of values. It is essential to provide at least two values to ensure the function’s optimal performance.
How To Use VAR.P Function In Excel? (With Steps)
To utilize the VAR.P function in Excel proficiently, follow these steps.
- Firstly, ensure that you have a dataset where you want to calculate the population variance. Select an empty cell where you want your result to appear. Then, type “=VAR.P(” in that cell.
- Next, select the range of cells containing your data. You can either manually input the range or use your mouse to select it by clicking and dragging over it.
- Afterward, finish off the formula by entering “)” and pressing Enter. The cell will now display the population variance of the selected data range.
- It is vital to note that VAR.P calculates variance based on an entire population rather than just a sample subset.
- Consequently, incorporating this function in Excel offers valuable insights into analyzing large datasets accurately, contributing to effective decision-making and improved statistical analysis within professional settings.
Examples
Example #1
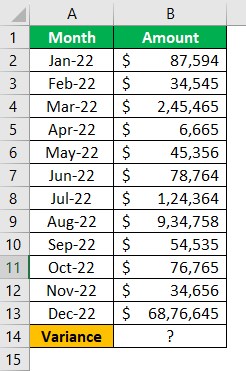
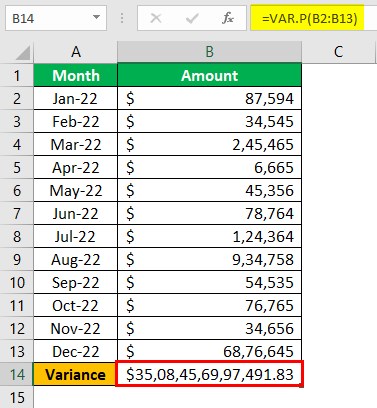
Suppose we are provided with the monthly sales figures of a business for the year, as displayed below:
To calculate the variance of the given population, we employ the following formula:
=VAR.P(B2:B13)
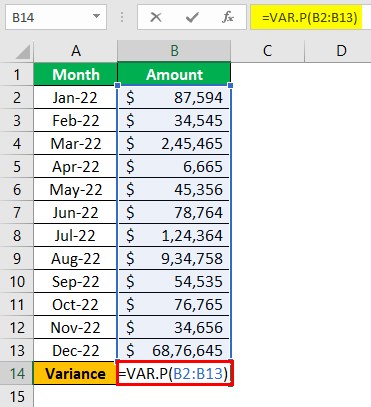
The resulting outcomes are as follows:
Example #2
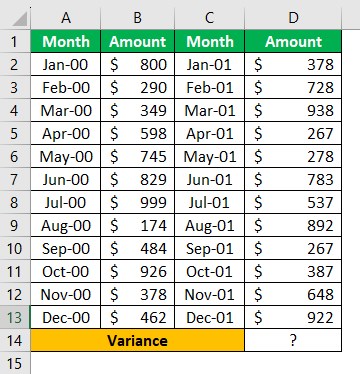
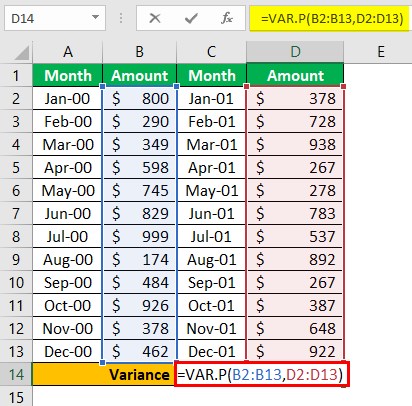
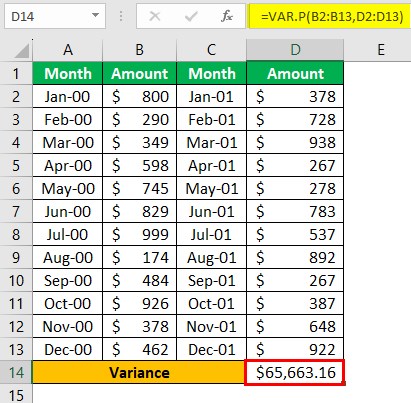
Suppose we have been given the monthly sales figures of a business for the past two years, as shown below:
To determine the variance of the provided population, we utilize the following formula:
=VAR.P(B2:B13, D2:D13)
The resulting outcomes are as follows:
Example #3
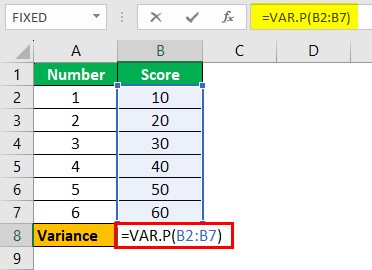
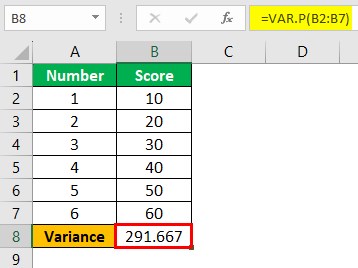
Assuming we have been granted access to the number of the scores, as presented in the table below:
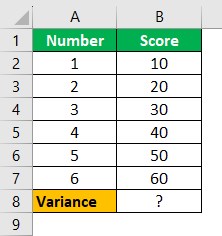
To ascertain the variance of the provided population, we shall employ the following formula:
=VAR.P(B2:B7)
The resulting outcomes are as follows:
Important Things To Note
- The VAR.S function, which estimates the sample variance based on a portion of the total population.
- The distinction is important when analyzing larger datasets where considering every data point becomes essential.
- The VAR.P function empowers analysts, statisticians, and researchers by offering them precise insights into the variability within a population, aiding decision-making processes and producing accurate results.
- It is important to note that VAR.P only considers numbers in the given references, disregarding empty cells, text, and logical values such as TRUE or FALSE.
Frequently Asked Questions
1. What is the purpose of the VAR.P function in Excel?
The VAR.P function in Excel serves as a statistical tool for measuring the variability or dispersion of data within a population.
As an illustration, we have been provided with the following amount of the items:
To calculate the variance, you can employ the following formula: =VAR.P(B2:B6)
The resulting outcomes are as follows: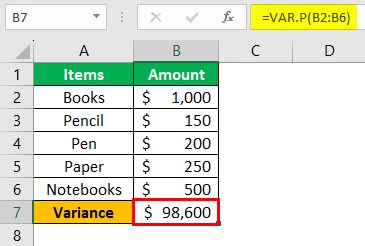
2. What type of data can be used with the VAR.P function?
The VAR.P function in Excel is an essential tool used for calculating the variance of a set of data. However, it is important to understand the specific requirements regarding the type of data that can be used with this function. The VAR.P function is designed to work with numerical data sets where each observation represents a separate value or measurement. It can analyze a large variety of data types, including financial values such as stock returns or portfolio performance, scientific measurements like temperature readings or experimental results, and even social science data such as survey responses or demographic information.
3. Are there any common mistakes to avoid when using the VAR.P function?
• One common pitfall is misinterpreting the results due to incorrect input data. Users should ensure that they provide a correct range of numerical values as arguments in order to obtain accurate results.
• Another mistake to avoid is ignoring the limitations of the VAR.P function in handling empty cells or non-numeric values within the given range, as this may lead to misleading outcomes.
• Additionally, it is important not to rely solely on VAR.P without considering other statistical measures such as mean or standard deviation since VAR.P provides a single measure of variability and may not give a comprehensive understanding of the dataset’s distribution.
Download Template
This article must help understand the VAR.P function in Excel examples. We can download the template here to use it instantly.
Recommended Articles
This has been a guide to What Is VAR.P Excel?. We learn how to use VAR.P in excel with step by step guide, examples & points to remember. You can learn more from the following articles –