Part of our Statistical Functions in Excel guide
Poisson Distribution in Excel
The Poisson distribution is a type of distribution used to calculate the frequency of events that will occur at any fixed time, but the events are independent. In Excel 2007 or earlier, we had a built-in function to calculate the Poisson distribution. For the above 2007 versions, the function is replaced by POISSON.DIST function.
Syntax
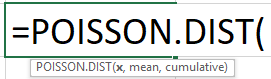
X: This is the number of events. It should be >=0.
Mean: The expected number of events. It should also be >=0.
Cumulative: This will decide the type of distribution to be calculated. We have two options here: TRUE or FALSE.
- TRUE indicates the probability of many events happening between zero and x.
- FALSE suggests the probability of the number of events happening the same as the x.
Examples
Example #1
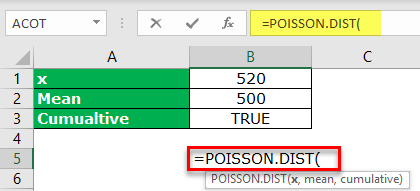
As a car rental company owner, your average weekend car rental customers are 500. However, you are expecting 520 customers in the coming weekend.
You want to know the probability of this event occurring in the coming week.
- Here, x is 520, and the mean is 500. Enter these details in Excel.

- Open the POISSON.DIST functions in any of the cells.

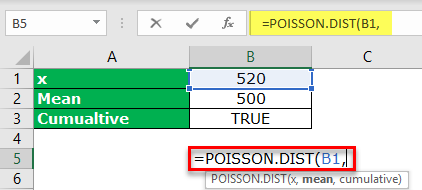
- Select the x argument as the B1 cell.

- Then, select the Mean argument as a B2 cell.

- We are looking at the “cumulative distribution function,” so select “TRUE” as the option.

- So, we got the result of 0.82070. Now, in the below cell, apply the formula: 1 – B5.


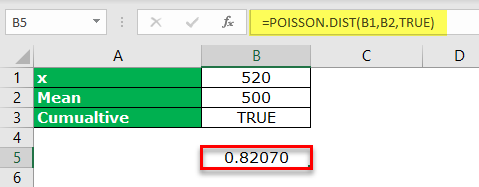
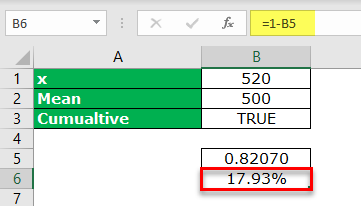
So, the probability of increasing car rental customers from 500 to 520 in the coming week is about 17.93%.
Example #2
In producing 1,000 units of automobile products, the average percentage of defect products is about 6%. Similarly, in a sample of 5,000 products, what is the probability of having 55 defect products?
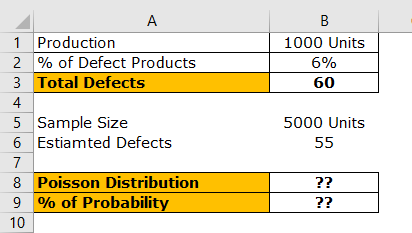
First, calculate the number of defect products in 1,000 units. i.e. λ = np. λ = 1000 * 0.06.
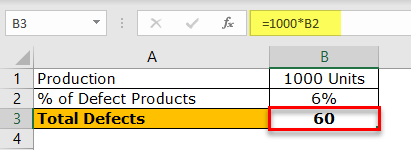
So, the total number of defect products in 1,000 units is 60. Now, we got the total defects number (x). So x = 60.
Now, to decrease the defect products from 60 to 55, we need to find the Excel Poisson distribution percentage.
So, MEAN = 55, x = 60.

The above formula will give us the Poisson distribution value. For example, apply the formula 1 – Poisson distribution in the below cell in Excel.
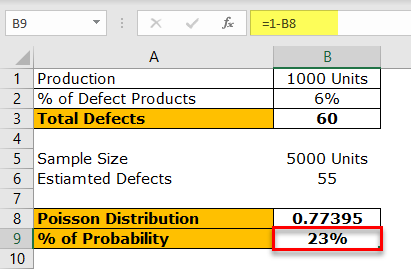
So, the probability of reducing defect items from 60 to 55 is about 23%.
Things to Remember
- We will get the #NUM! Error is the supplied x, and Mean values are less than zero.
- We will get #VALUE! Error if the arguments are non-numeric.
- If the supplied numbers are decimal or fraction, then Excel rounds automatically to the nearest integer number.
Recommended Articles
This article is a guide to Poisson Distribution in Excel. Here, we discuss calculating Poisson distribution in Excel using the POISSON.DIST function, along with examples and downloadable Excel templates. You may also look at these useful functions in Excel: –