LINEST Function In Excel
The LINEST Excel function is used to calculate the statistics for a line. It uses the least-squares regression, and returns an array that describes the straight-line best fits given data.
We can insert the Excel LINEST Function from the formulas tab or insert the formula directly in the worksheet, as it is an inbuilt function.
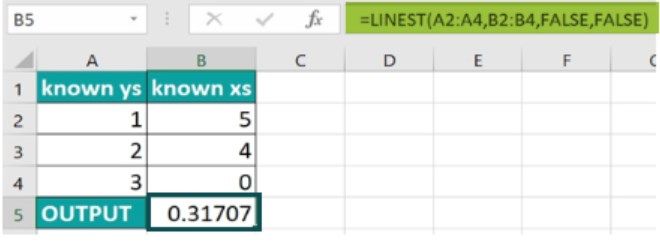
For example, when we have the x and y values as shown in the table below, we can find the Linest values as follows:
In cell B5, enter the formula =LINEST(A2:A4,B2:B4,FALSE,FALSE), and press the “Enter” key.

We get the output as 0.31707, as shown above.
Key Takeaways
- The LINEST Excel function is a Statistical function that generates regression statistics for a linear regression model.
- When there’s only one independent x-variable, slope, and y-intercept values can directly be calculated by using the following formulas:
- Slope: =INDEX (LINEST (known_ys, known_xs),1)
- Y-intercept: =INDEX (LINEST (known_ys, known_xs),2)
- We can describe a straight line with slope and y-intercept:
- Slope (m): To find the slope of a line, often represented as m: – For a line with two points (x1, y1) and (x2, y2); the slope is calculated as m = (y2 – y1) / (x2 – x1).
- Y-intercept (b): The y-intercept of a line, often represented as b, is the value of y at the point where the line crosses the y-axis.
- The equation of a straight line is y = mx + b. Once the values of m and b are known, we can calculate any point on the line by putting the y- or x-value into the equation. For example, see the TREND function in Excel.
Syntax Of The LINEST Formula In Excel
Below is the LINEST Formula in Excel.
The =Equation for the Line is:
y = mx + b
–or–
y = m1x1 + m2x2 + m3x3 + … + b
The LINEST formula’s arguments are,
- known_y’s: It is a required parameter and indicates the set of y-values already known in the relationship y = mx + b.
- If the range of known_y’s is in a single column, each column of known_x’s is interpreted as a separate variable.
- Likewise, if the range of known_y’s is in a single row, each row of known_x’s is interpreted as a different variable.
- known_x’s: It is an optional parameter and indicates the set of x-values already known in the relationship y = mx + b.
- The range of known_x’s can have one or more sets of variables. If only one variable is used, known_y’s and known_x’s can be the ranges of any shape with equal dimensions.
- If more than one variable is used, known_y’s must be a vector (i.e., a range with a height of one row or width of one column).
- const: It is an optional parameter and represents a logical value (TRUE/FALSE) specifying whether to force the constant b to be equal to 0.
- If const is TRUE or skipped, b is calculated normally.
- If const is FALSE, b is set equal to 0, and the m-values are adjusted to fit y = mx.
- stats: It is an optional parameter and represents a logical value (TRUE/FALSE) specifying whether to return additional regression statistics.
- If stats is TRUE, LINEST in excel returns the additional regression statistics; as a result, the returned array is {mn , mn-1,…,m1,b;sen,sen-1,…,se1,seb;r2,sey;F,df;ssreg,ssresid}.
- If stats are FALSE or skipped, LINEST in Excel returns only the m-coefficients and the constant b.
Video Explanation of LINEST Excel Function

How To Use The LINEST Function In Excel?
The LINEST function is used in 2 ways, namely,
- Access from the Excel ribbon.
- Enter in the worksheet manually.
Method #1 – Access from the Excel ribbon
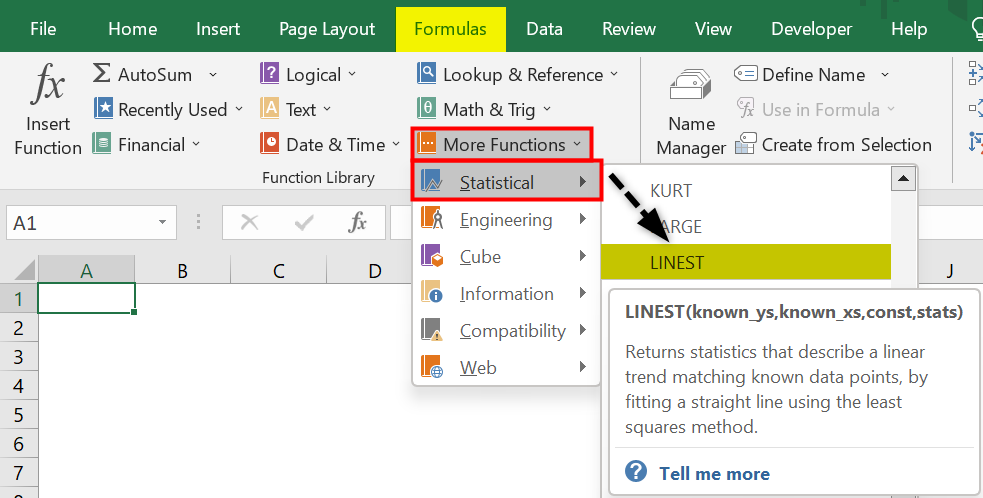
First, choose an empty cell → select the “Formulas” tab → go to the “Function Library” group → click the “More Functions” option drop-down → click the “Statistical” option right arrow → select the “LINEST” function, as shown below.
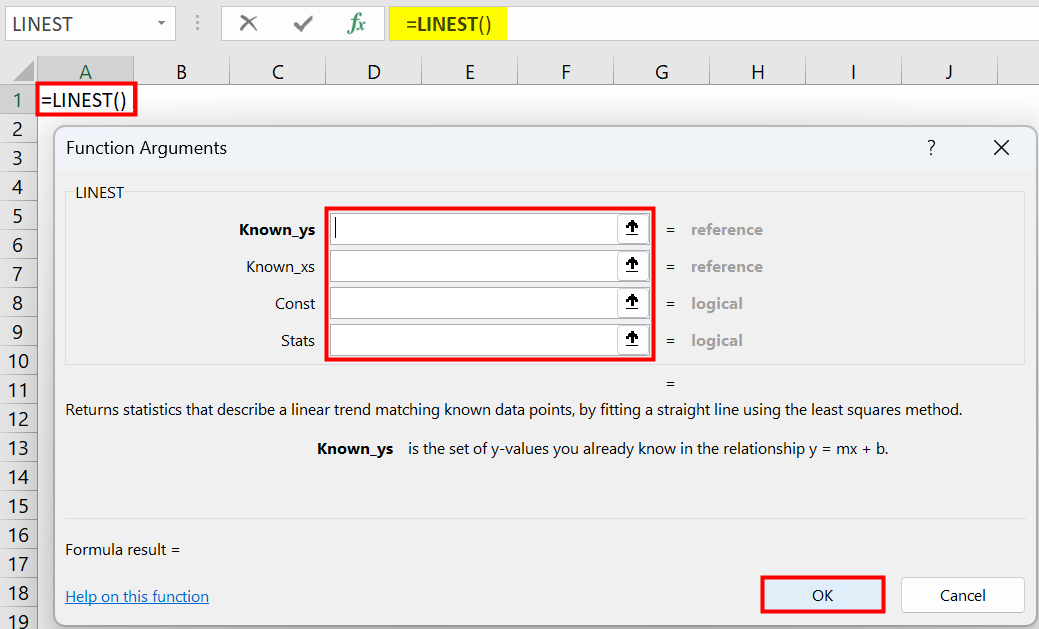
The “Function Arguments” window opens. Enter the arguments in the “Known_ys, Known_xs, Const, Stats” fields, and click “OK”, as shown below.
Method #2 – Enter in the worksheet manually
- Choose an empty cell for the output.
- Type =LINEST( in the cell. [Alternatively, type =L or =LI, select the LINEST function from the suggestions given by Excel]
- Enter the arguments as cell values or cell references.
- Close the brackets, and press the “Enter” key to execute the formula.
Examples
We will see some specific examples of the LINEST function options, namely,
- Slope.
- Simple Linear Regression
Example #1 – Slope
We will calculate the statistics for a line or Slope using the LINEST function for the given values.
Select cell C2, enter the formula =LINEST (B2:B5, C2:C5, , FALSE), and press “Enter”.
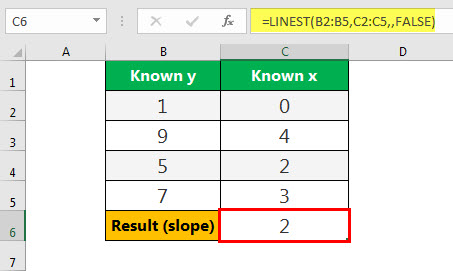
The above formula shows that B2:B5 is the known_ys, and C2:C5 is known_xs. The third parameter, i.e., const, is left blank so that it will be calculated. Finally, the fourth parameter, stats, is marked FALSE.
Therefore, the output is “2”, as shown above for the given data.
Example #2 – Simple Linear Regression
= SUM (LINEST(B1:B6, A1:A6)*{9,1})
As shown in the above LINEST formula in Excel, A1:A6 is the month number, and B2:B6 indicates the corresponding sales figures. So, based on the six-month sales data, sales data for the 9th month is to be estimated.
Important Things To Note
- When entering an array constant (known_xs) as an argument, we can use commas to separate values in the same row and semicolons to separate the rows. Separator characters may vary depending on native regional settings.
- The y-values predicted by the regression equation may not be valid if they are outside the range of the y-values used to determine the equation.
- Formulas that return arrays must be entered as array formulas.
Frequently Asked Questions (FAQs)
What does the LINEST function do in Excel?
The LINEST Excel function is a linear regression function that predicts data following a straight line. Linear Regression predicts values such as sales growth, inventory requirements, or simple market trends.
The syntax of the LINEST function is =LINEST(known_ys,,,).
How to enter the LINEST function in Excel?
We can enter the LINEST function in Excel formula as follows:
1. Choose an empty cell for the output.
2. Type =LINEST( in the cell.
3. Enter the arguments as cell values or cell references.
4. Close the brackets, and press the “Enter” key to execute the formula.
Where is the LINEST function in Excel?
The LINEST function in Excel is inserted as shown below,
Choose an empty cell for the output → select the “Formulas” tab → go to the “Functions Library” group → click the “More Functions” drop-down → click the “Statistical” right-arrow → click the “LINEST” function, as shown below.
Recommended Articles
This article is a guide to LINEST Excel Function. Here we generate regression statistics for a linear regression model, examples & downloadable excel template. You may also look at these useful functions in Excel: –