Efficient Frontier Definition
The efficient frontier, also known as the portfolio frontier, is a set of ideal or optimal portfolios expected to give the highest return for a minimal return. It manifests the risk-and return trade-off of a portfolio. This frontier is formed by plotting the expected return on the y-axis and the standard deviation as a measure of risk on the x-axis. For building the frontier, there are three important factors to be taken into consideration:
Key Takeaways
- Expected return,
- Variance/ Standard Deviation as a measure of the variability of returns, also known as risk and
- The covariance of one asset’s return to that of another asset.
The American Economist Harry Markowitz established this model in 1952. After that, he spent a few years researching the same, eventually winning the Nobel Prize in 1990.
- The efficient frontier, or the portfolio frontier, describes the ideal portfolios predicted to produce the highest return with the lowest risk. It depicts the link between risk and returns for a portfolio, with expected return on the y-axis and standard deviation as a risk measurement on the x-axis.
- It is vital to consider three key factors: expected return, risk (measured by variance or standard deviation), and the correlation between the returns of different assets.
- The approach was created by American economist Harry Markowitz in 1952. He dedicated several years to studying the subject before winning the Nobel Prize in 1990.
Example of the Efficient Frontier
Let us understand the construction of the efficient frontier with the help of a numerical example:
Assume two assets, A1 and A2, are in a particular portfolio. Calculate the risks and returns for the two assets whose expected return and standard deviation are as follows:
| Particulars | A1 | A2 |
|---|---|---|
| Expected Return | 10% | 20% |
| Standard Deviation | 15% | 30% |
| Correlation Coefficient | -0.05 |
Let us now give weights to the assets, i.e., a few portfolio possibilities of investing in such assets as given below:
| Portfolio | Weight (in %) | |
|---|---|---|
| A1 | A2 | |
| 1 | 100 | 0 |
| 2 | 75 | 25 |
| 3 | 50 | 50 |
| 4 | 25 | 75 |
| 5 | 0 | 100 |
Using the formula for Expected Return and Portfolio Risk i.e.
Expected Return = (Weight of A1 * Return of A1) + (Weight of A2 * Return of A2)
Portfolio Risk = √ [(Weight of A12 * Standard Deviation of A12) + (Weight of A22 * Standard Deviation of A22) + (2 X Correlation Coefficient * Standard Deviation of A1 * Standard Deviation of A2)],
We can arrive at the portfolio risks and returns as below.
| Portfolio | Risk | Return |
|---|---|---|
| 1 | 15 | 10 |
| 2 | 9.92 | 12.5 |
| 3 | 12.99 | 15 |
| 4 | 20.88 | 17.5 |
| 5 | 30 | 20 |
Using the above table, if we plot the risk on the X-axis and the Return on Y-axis, we get a graph that looks as follows and is called the efficient frontier, sometimes referred to as the Markowitz bullet.
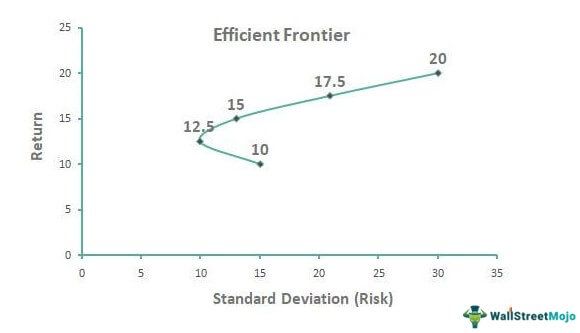
In this illustration, we have assumed that the portfolio consists of only two assets A1 and A2, for simplicity and easy understanding. We can, in a similar fashion, construct a portfolio for multiple assets and plot it to attain the frontier. In the above graph, any points outside the frontier are inferior to the portfolio on the efficient frontier because they offer the same return with higher risk or lesser return with the same amount of risk as those on the frontier.
From the above graphical representation of the efficient frontier, we can arrive at two logical conclusions:
- It is where the optimal portfolios are.
- The efficient frontier is not a straight line. It is curved. It is concave to the Y-axis.
However, the efficient frontier would be a straight line if we are constructing it for a complete risk-free portfolio.
Assumptions of the Efficient Frontier Model
- Investors are rational and know all the facts about the markets. This assumption implies that all the investors are vigilant enough to understand the stock movements, predict returns, and invest accordingly. That also means that this model assumes all investors are on the same page regarding knowledge of the markets.
- All investors have a common goal: avoid the risk because they are risk-averse and maximize the return as far as possible and practicable.
- There are not many investors who would affect the market price.
- Investors have unlimited borrowing power.
- Investors lend and borrow money at a risk-free interest rate.
- The markets are efficient.
- The assets follow a normal distribution.
- Markets absorb information quickly and accordingly base the actions.
- The investors’ decisions are always based on expected return and standard deviation as a measure of risk.
Merits
- This theory portrayed the importance of diversification.
- This efficient frontier graph helps investors choose the portfolio combinations with the highest and least possible returns.
- It represents all the dominant portfolios in the risk-return space.
Drawbacks/Demerits
- The assumption that all investors are rational and make sound investment decisions may not always be true because not all investors would have enough knowledge about the markets.
- The theory can be applied, or the frontier can be constructed only when a concept of diversification is involved. If there is no diversification, the theory would certainly fail.
- Also, the assumption that investors have unlimited borrowing and lending capacity is faulty.
- The assumption that the assets follow a normal distribution pattern might not always stand true. In reality, securities may have to experience returns far from the respective standard deviations, sometimes like three standard deviations away from the mean.
- The real costs, like taxes, brokerage, fees, etc., are not considered while constructing the frontier.
Conclusion
To sum up, the efficient frontier displays a combination of assets with the optimal expected return level for a given level of risk. It depends on the past and keeps changing every year; there is new data. After all, the past figures need not necessarily continue in the future.
All the portfolios on the line are ‘efficient,’ and the assets that fall outside the line are not optimal because either they offer a lower return for the same risk or riskier for the same level of return.
Although the model has its demerits, like the non-viable assumptions, it has been earmarked to be revolutionary when it was first introduced.
Frequently Asked Questions (FAQs)
How many portfolios are on an efficient frontier?
Portfolio managers and investors can customize the securities in their investment universe to meet their specific requirements. As a result, there is no single efficient frontier that applies universally.
Can a portfolio be above the efficient frontier?
Investors’ risk preferences determine which portfolio on the efficient frontier they choose. Therefore, it’s impossible to have a portfolio above the efficient frontier, and portfolios below it are considered inefficient. Any portfolio above the efficient frontier is considered suboptimal because it either has a higher level of risk for a given expected return or a lower expected return for a given level of risk.
Why is efficient frontier concave?
The efficient frontier is a curved line because the return on investment increases slightly as risk increases. This results in a diminishing marginal return to risk, which creates the curvature of the line.
Recommended Articles
This has been a guide to an efficient frontier and its definition. Here we discuss an example of an efficient frontier with the graph. You can learn more from the following portfolio management articles –