Table of Contents
Color Formatting in Financial Models
Color Formatting in the financial model refers to the display of format or information that assists the reader or user in identifying specific pairs of information & in correlating things quickly. The most critical parameters for color formatting are consistency, efficiency & clarity. Lack of any of these may not serve the purpose of providing the financial model..
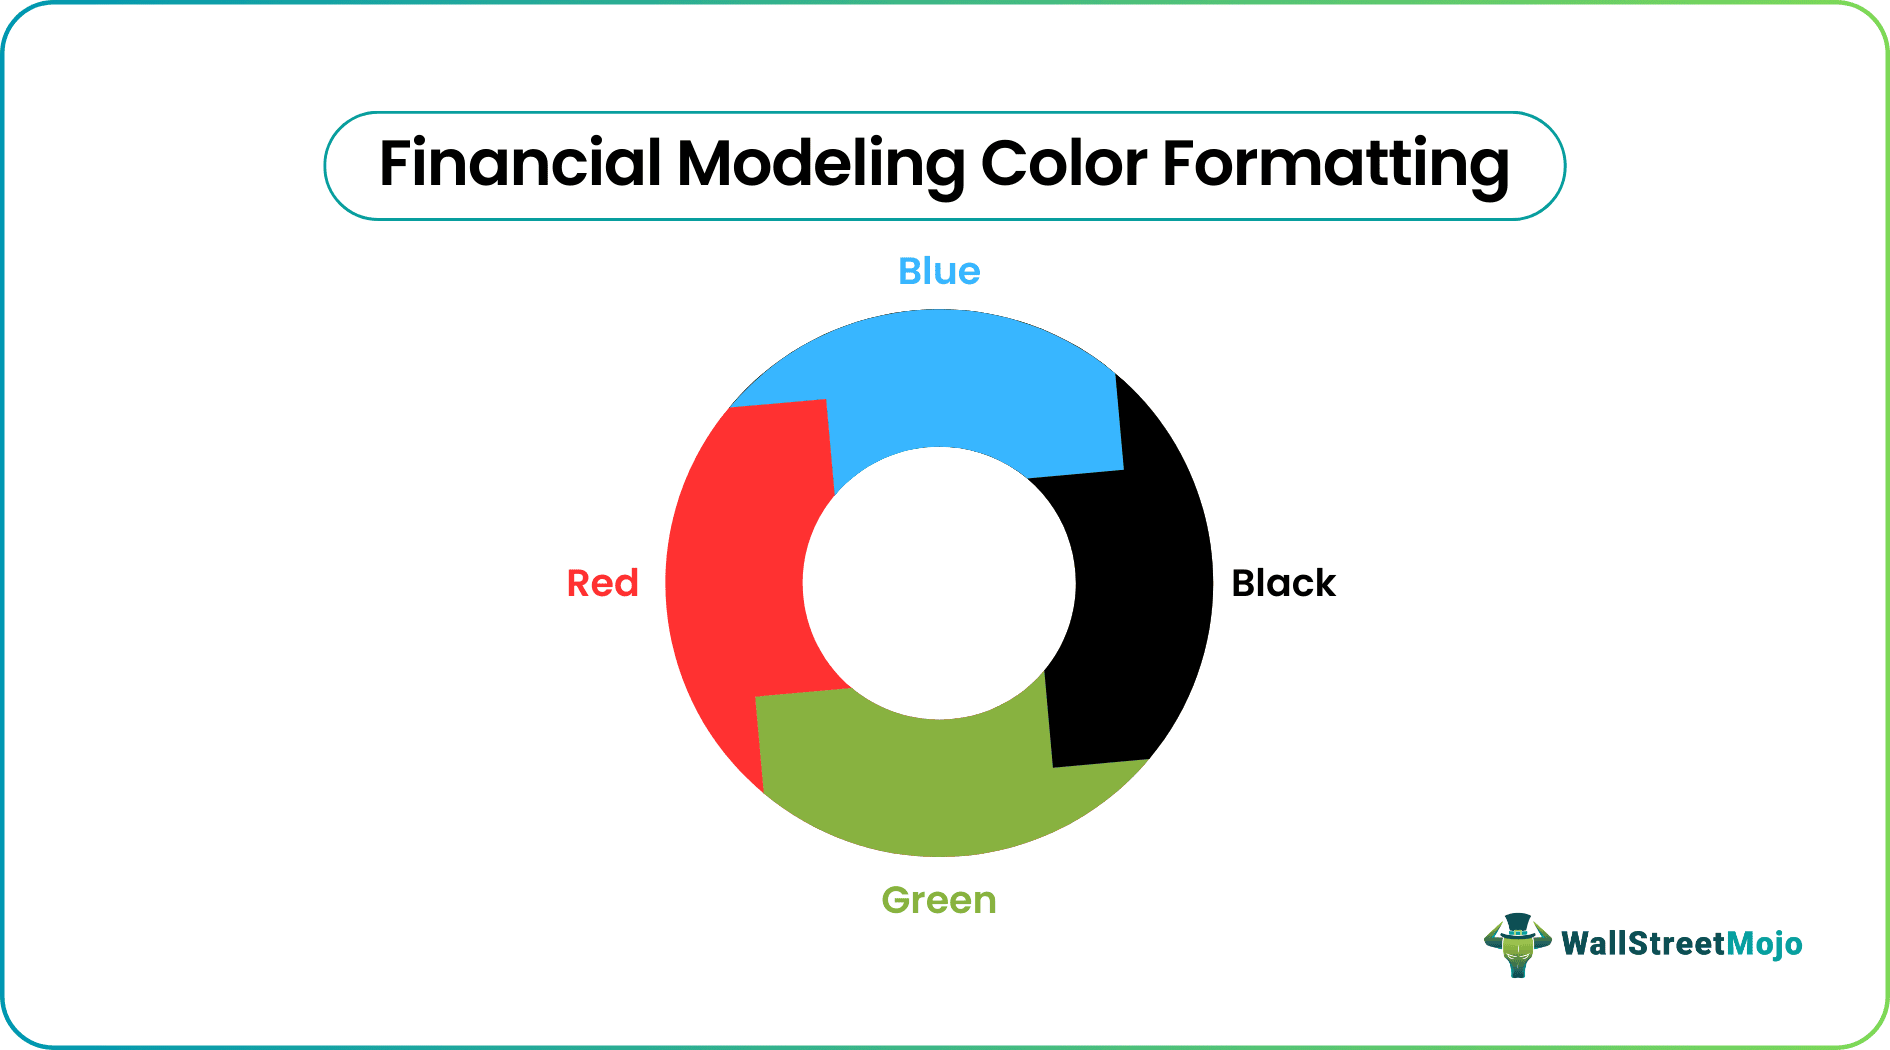
Correct and proper color formatting in financial models helps to make it more user-friendly and easier to interpret. They give the model more clarity if the colors are used in a balanced and strategic manner. The main aim of the process is to make it visually appealing and easy to identify and use.
Financial Modeling Color Formatting Explained
The process of color formatting in financial models is the technique that analysts use to enhance the use and clarity of presentation of financial models and spreadsheets. The colors make the model easy to interpret and use. The numerical data can be identified as related to historical, current or future forecast based on these colors.
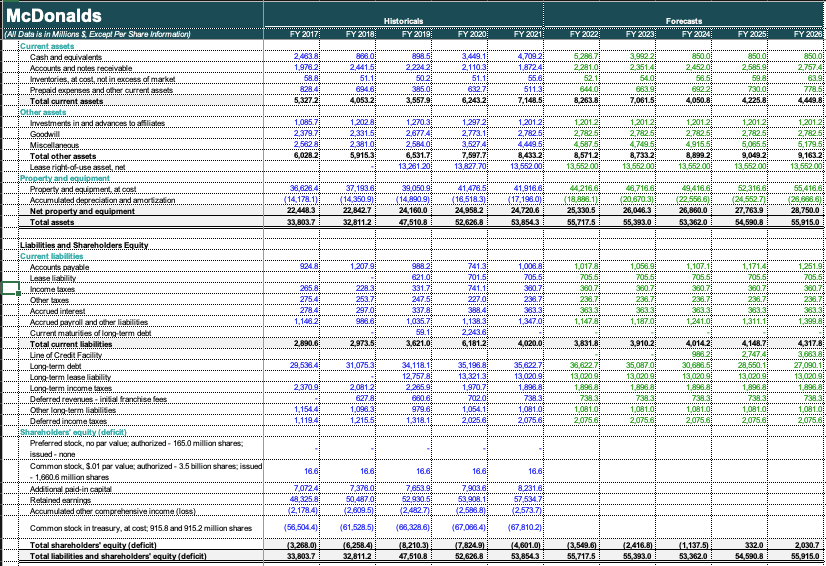
Image Source: Financial Modeling and Valuation Course Bundle
Using colors to highlight any specific data type makes the entire document visually appealing and easy to use. The colors also segregate different categories of data that should catch the reader’s attention.
Color formatting is done to the cells & data within each financial model. The most commonly used color formatting is as follow:
- Blue: For hardcoded (i.e. typed) inputs. It can be some historical information or something which you assume or the key driver (such as rate of interest, rate of tax, output, etc.) used in the model.
- Black: For calculation & cell references within the same sheet (i.e. all formulae are in black font)
- Green: For references made to other sheets. However, one may keep the color format here as black & may avoid this color.
- Red: For external links outside the working file.
Thus, color the cell & contents within each cell helps the readers. This also helps in linking the flow of different pieces of data within different sheets & files.
Besides this as one of the features of Excel, there are other functions and formula, which independently or as a combination, help retrieve and analyze data properly. If you wish to explore such functions or features, you can check this Crash Course in Excel LOOKUP Function.
In addition, if you want to explore financial modeling as a process, this Financial Modeling Course is recommended, which will not only give you knowledge, but also an industry-recognized certification.
Example
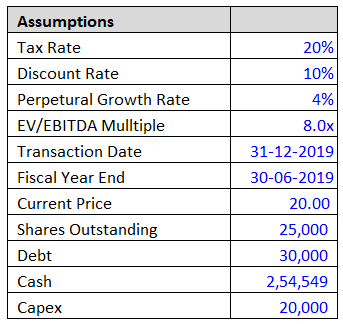
Below is an example that shows how the models are prepared using various colors and how the reader or user of the model will understand what kinds of data the colors are trying to portray.
Let’s take a classic template for understanding:
Projected Financials:
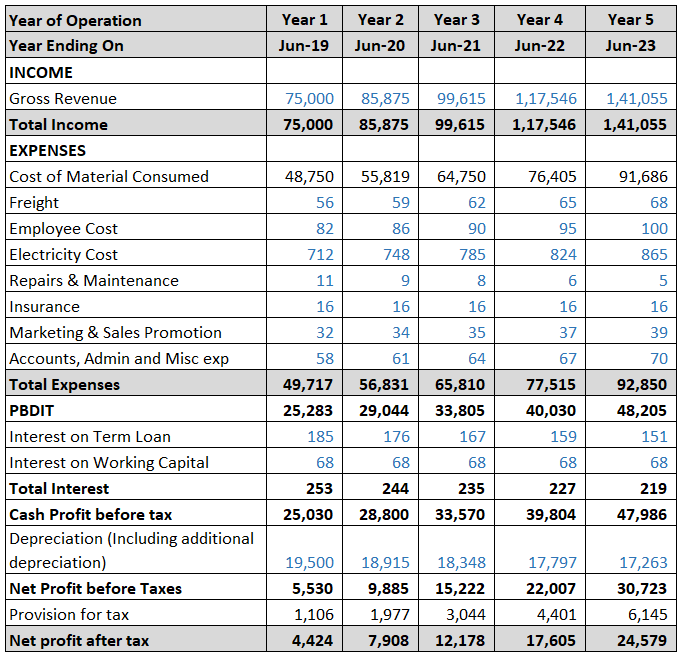
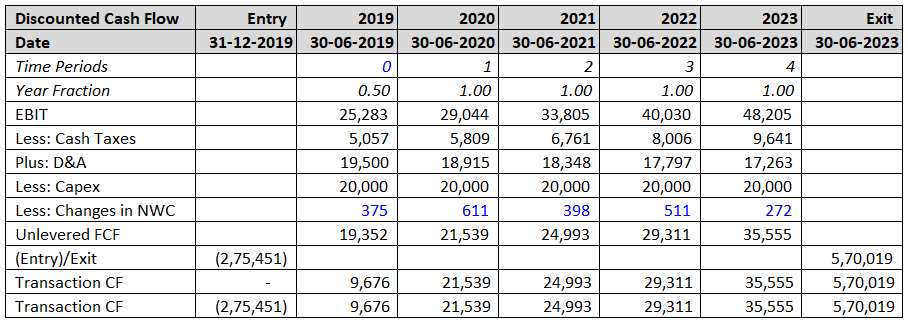
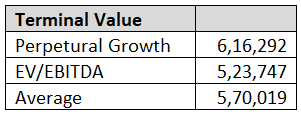
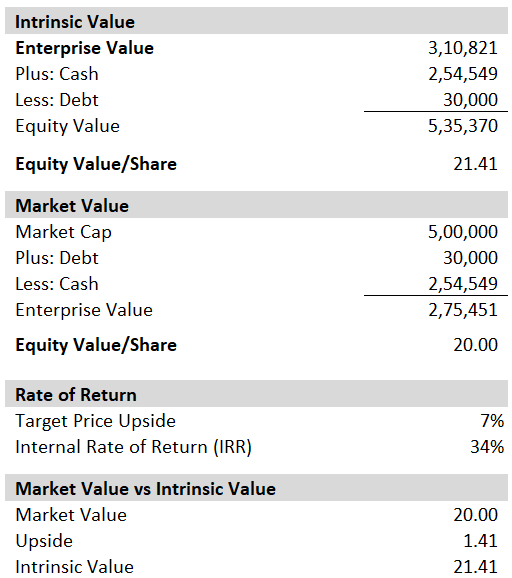
Explanation:
- We have used the color codes as defined in the topic.
- The flow is maintained for assumption, calculations & summary.
Shading Color Formatting
Shading color is another type of formatting using colors that help in distinguishing between different parts of the excel, mainly the heading and subheadings from the calculation details. This provides a quick way to identify the main totals and subtotals easily. Let us go through the method of shading.
- Shading color formatting means to apply a similar texture to each heading, or each subheading, or each featured line item. Choose one color format for each of these & make sure you maintain the same format for each working sheet within the file.
- Heading means name of the company & name of the working sheet. For Example, the Name of the company is “ABC Inc” & the name of the working sheet is “ABC Inc” & the name of the working sheet is “Balance Sheet” or “Profitability Statement” or “Discounted Cash Flow”. Heading can be just bold & different font types with underline & a little higher font size. One may prefer to keep a certain color in the background.
- Sub-heading means the reference cell for the columns, i.e. particulars, years, etc. The subheading should ideally be light gray with the black font for the cell. One may prefer a light blue color with black font.
- The featured line item means the important area or important line item in the file. It can be a total of assets or total of liabilities or profits or final answer, etc. One may keep any color with a bold font.
Importance
Given below are the importance of using colors for the purpose of formatting data in the cells.
- Color formatting helps easy identification of cells.
- It differentiate the cells based in direct input and calculation, which helps in identifying where the user may make any changes.
- A standard is set for readers for the identification of information.
- It gets the reader involved in the working of the model.
- The working file becomes more attractive & appealing.
- A consistent flow can be maintained for enhancing the understandability of the model.
- The user can easily identify which cells have formula in them and which cells only display the result.
- It creates a visual hierarchy, which makes it easy to navigate within the sheet. The headers, titles, headings and subheads should be colored differently for easy identification.
- Since the assumptions and real data are colored seperately, it helps users understand the effect of different types of data in the final output.
- Since the colors are also visible in a printed format, it becomes useful even in a hard-copy form.
Thus, the above uses make the entire process of color formatting in the models very crucial. However, there should be a proper balance in the format, without any overuse of colors.


