Box IPO Valuation Complete Guide
On March 24, 2014, Online storage company Box filed for an IPO and unveiled its plans to raise US$250 million. The company is in the race to build the largest cloud storage platform, and it competes with the biggies like Google Inc and its rival, Dropbox.
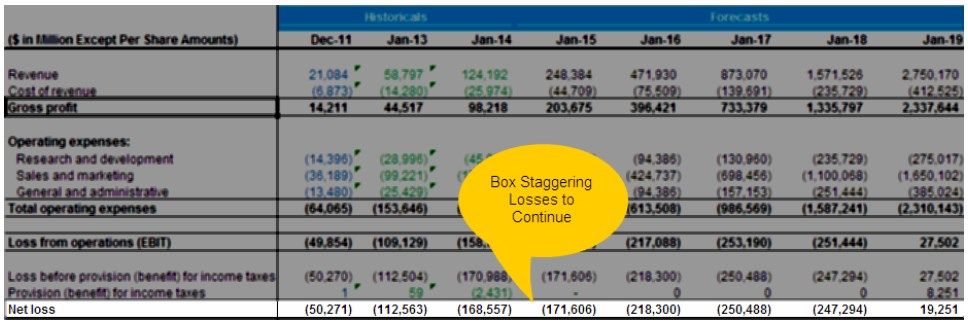
Scanning through the Box S-1 Filing, you may note that Box is a typical Silicon Valley IPO Company, with rapid revenue growth and a mountain of losses. If you have already decided to invest in Box Inc, please do NOT read my article on Top 10 Scariest Details of the (Black) Box IPO.
Box IPO Valuation
As seen from above, Box’s massive losses and no profitability shortly leave us with fewer options for valuing this firm using the traditional methods such as Price to EPS (PE), PEG, EV/EBITDA, etc. fail. So how do we find the value of Box?
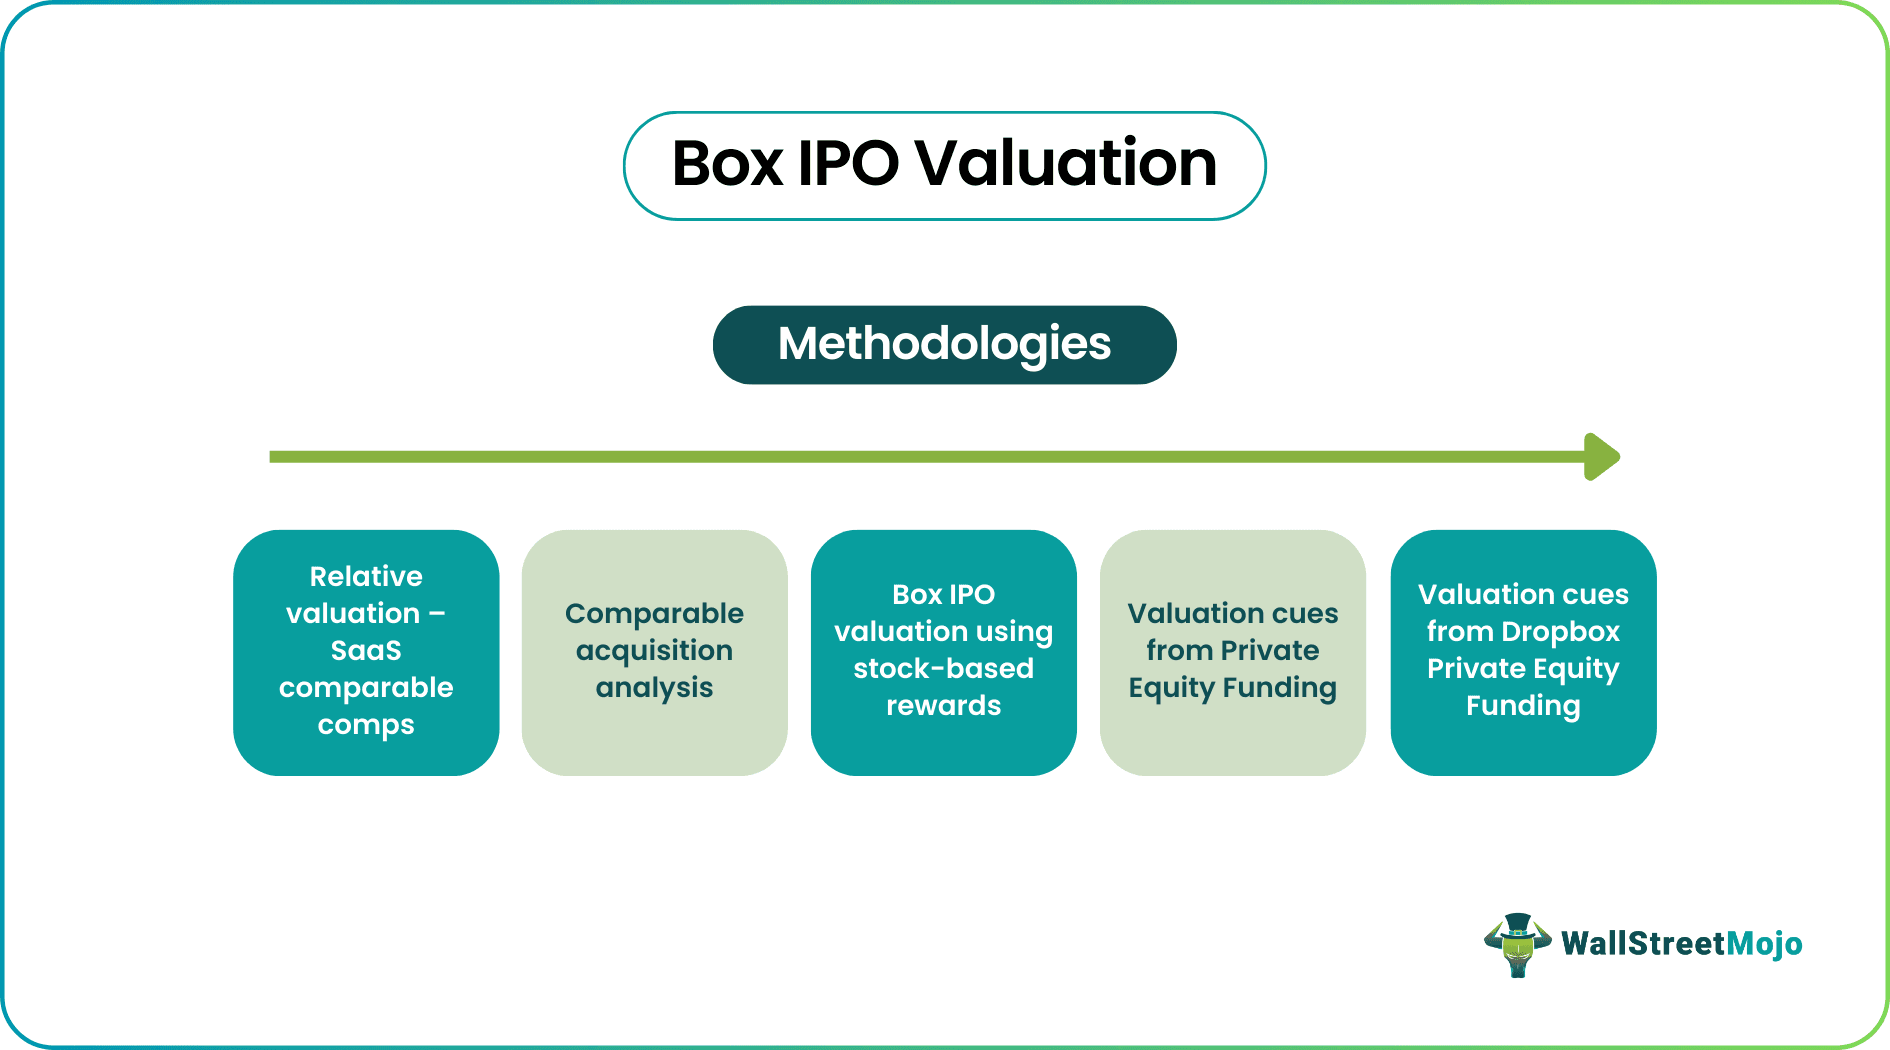
If you wish to learn more about valuation, you can read this article on Equity Value vs. Enterprise Value. For Box IPO valuation, I have used the following approaches –
- Relative Valuation – SAAS Comparable Comps
- Comparable Acquisition Analysis
- Valuation using Stock-Based Rewards
- Valuation cues from Box Private Equity Funding
- Valuation cues from DropBox Private Equity Funding Valuation
- Box DCF Valuations
Before diving deep into the Box IPO approach, you can have a look at this Financial Modeling and Valuation Course Bundle, which covers different types of modeling and valuation tricks to be implemented for proper planning beforehand based on the results obtained.
The graph below summarizes Box IPO Valuation under a different scenario.
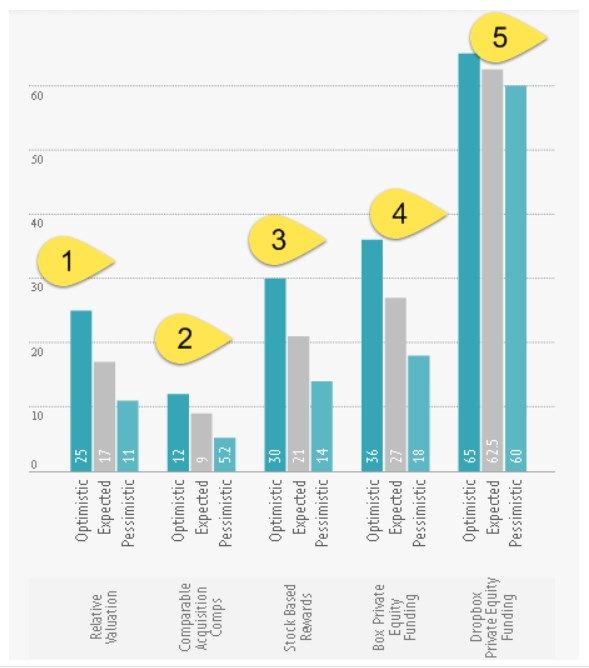
Summary of the Analysis
- Cannot apply DCF valuation (#6) as the FCFF is negative even for the projected FY19.
- Comparing Box valuation (#5) with Dropbox recent funding implies the highest range of share price ($60/share-$65/share)
- Comparable Acquisition comps (#3) provides the lowest range of share price valuations ($5.2/share – $12/share)
- Overall, if we allocate 20% Weightage to each of the above valuation methodologies, then the Box IPO expected price comes out to be $27/share
Let us now closely look at the detailed analysis of the Box IPO valuation methodologies used –
#1 – Relative Valuation – SaaS Comparable Comps
As seen from above, Box’s massive losses and no profitability shortly leave us with fewer options for valuing this firm using the traditional methods such as Price to EPS (PE), PEG, EV/EBITDA, etc. fail. So how do we find the value of Box?
If you wish to learn more about valuation, you can read this article on Equity Value vs. Enterprise Value. For Box IPO valuation, I have used the following approaches –
- Relative Valuation – SAAS Comparable Comps
- Comparable Acquisition Analysis
- Valuation using Stock-Based Rewards
- Valuation cues from Box Private Equity Funding
- Valuation cues from DropBox Private Equity Funding Valuation
- Box DCF Valuations
The graph below summarizes Box IPO Valuation under a different scenario.
Summary of the Analysis
- Cannot apply DCF valuation (#6) as the FCFF is negative even for the projected FY19.
- Comparing Box valuation (#5) with Dropbox recent funding implies the highest range of share price ($60/share-$65/share)
- Comparable Acquisition comps (#3) provides the lowest range of share price valuations ($5.2/share – $12/share)
- Overall, if we allocate 20% Weightage to each of the above valuation methodologies, then the Box IPO expected price comes out to be $27/share
Let us now closely look at the detailed analysis of the Box IPO valuation methodologies used –
#2 – Comparable Acquisition Analysis
“Comparable Acquisition Analysis” is based on the premise that a company’s or an asset’s value can be estimated by analyzing the prices paid by purchasers of ownership interests in reported comparable acquisitions. There have been a number of transactions within the SaaS domain recently. Below are some of the large M&A transactions in the recent past.
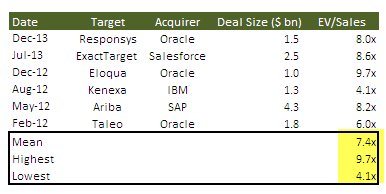
Based on the above comparable acquisition analysis, we can arrive at the following conclusions for Box Valuation –
- Mean EV/Sales of 7.4x implies a valuation of closer to $1.8 billion (implying a share price of $18.4/share)
- The highest EV/Sales of 9.7x implies a valuation of $2.4 billion (meaning a share price of $24.7/share)
- The lowest EV/Sales of 4.1x implies a valuation of $1.1 billion (meaning a share price of $9.3/share)
#3 – Box IPO Valuation Using Stock-Based Rewards
The following table summarizes, by grant date, all stock options, restricted stock units, and restricted stock awards from January 1, 2013, through January 31, 2014:
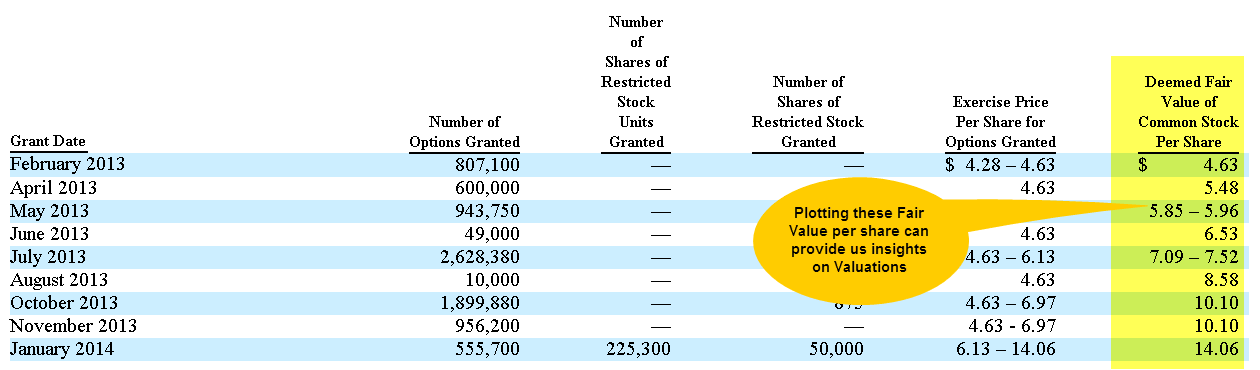
As per Box Inc S-1 filing, they have used three approaches primarily for valuing stock-based rewards –
- Income Approach (just like the DCF approach) – Estimating the future cash flows of the company and then discounting the future cash flows.
- Comparable Company Analysis with valuations based on Revenue (trailing 12 months and forward 12 months) and EBITDA Multiples (trailing 12 months and deliver 12 months).
- Mergers and Acquisition Transaction analysis
Box Inc arrived at these deemed fair prices by applying reasonable weights to Income Approach, matters to comparable company analysis, and Merger and Acquisition Transaction Analysis. After that, an appropriate marketability discount of around 20% was applied.
I plotted these deemed fair prices of Box Inc to see how it has changed over some time.
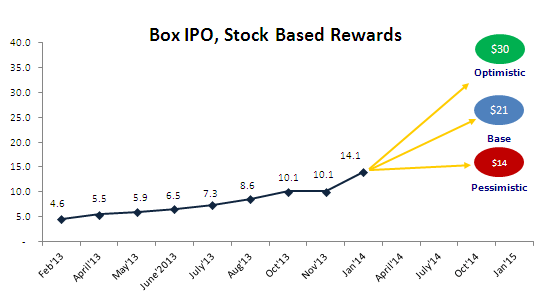
As we can see from the above, the Valuation of Box Inc Shares increased dramatically from $4.53 in Feb 2013 to $14.06 in Jan 2014 (an incredible jump of more than 200%!).
Does this imply that the valuation of Box Inc would continue the same momentum for the next year? Just based on trend, can a valuation number be arrived at?
- Optimistic Case – 100% appreciation – if a similar momentum continues, then the share prices may touch $30 per share at the end of Jan’2015.
- Expected Case – 50% appreciation – A jump of 50% from the current levels may lead to Box IPO price at $21 levels.
- Pessimistic Case – 0% appreciation – In the suspicious Case, Box shares may remain at the same level as the most recent deemed fair price of $14.1 in the near term.
#4 – Valuation cues from Private Equity Funding
Though it is good to understand the valuation range using the Stock-Based Rewards, a better measure to understand Box Inc valuations would be to look at its Private Equity Funding structure and its actual share price. Below is the graph that details the implied share price at various funding levels.
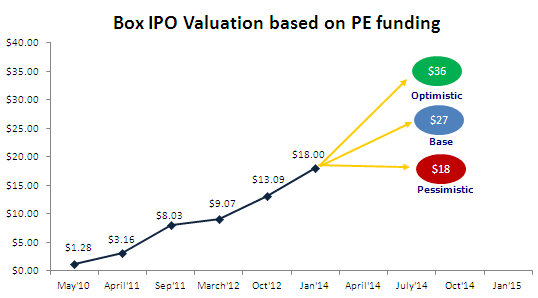
Note how Box Inc implied share price has increased from $1.28 to $18.00 since April 2010, reflecting a jump of whopping 1300%! (CAGR of 251%).
- Optimistic Case – 100% appreciation – if a similar momentum continues, then the share prices may touch $36 per share at the end of Jan’2015.
- Expected Case – 50% appreciation – the stock may trade at around $27.
- Pessimistic Case – 0% appreciation – In the suspicious Case, Box shares may remain at the same level as the most recent deemed fair price of $18 in the near term.
#5 – Valuation cues from Dropbox Private Equity Funding
In January 2014, WSJ reported that Dropbox raised $250 million funding from Blackrock and existing investors and pegged the company valuation at $10 billion. This is in addition to its October 2011 round of funding, where Dropbox raised $257 million at a valuation of $4 billion (more than double in approximately two years).
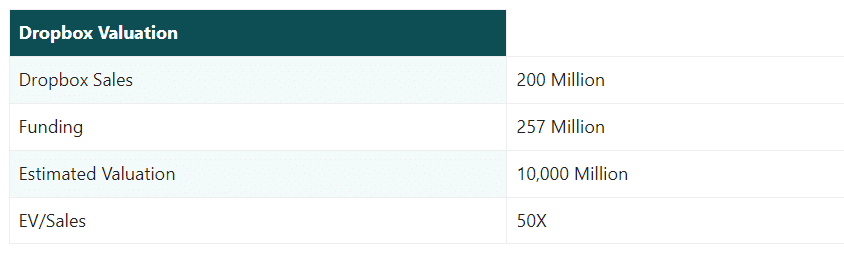
Drop Box reported its sales of around $200 million, implying an EV/Sales multiple of approximately 50x.
- Box Sales for FY14 was $127 million. If we apply the same multiple for Box, then the valuation would touch $6-6.5 billion.
- Assuming that post IPO, Box number of shares would be around 100 million; then the per-share value would be between $60-$65 per share
#6 – Discounted Cash Flow Approach for Box IPO Valuation
The Discounted Cash Flow (DCF) approach requires forecasting and modeling future financials. Though preparing a financial model was a relatively more straightforward task, the area where I faced problems was in assumptions ( Sales growth, Costs, Margins, Capex, etc.), all leading to the Free Cash flow to the firm.
Forecasting Box Free Cash Flow (FCFF)
Forecasting of FCFF of Box Inc involved preparing an integrated Box financial model. But here are some of the essential assumptions used in the model.
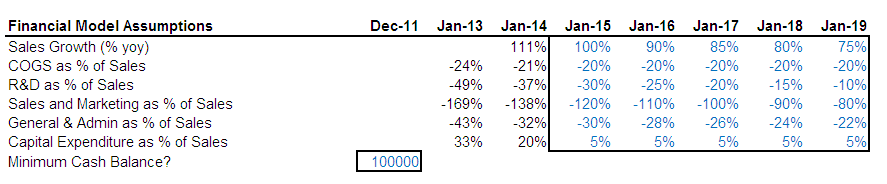
Using the above assumptions, we find that the company does not generate any free cash flows in the next five years.
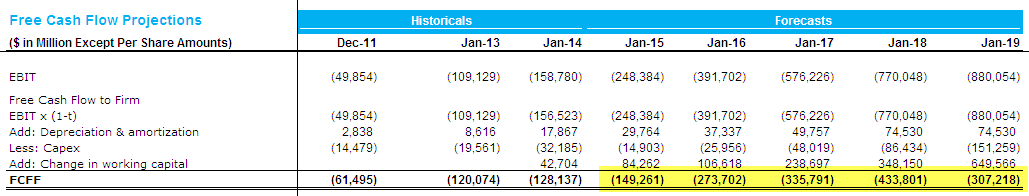
Following observations regarding the DCF Model for FCFF
- Box FCFF is harmful for the next five years. I feel it is not correct to forecast beyond this period as it introduces further volatility.
- Even if we forecast for another 5-10 years, the contribution of Terminal Value to Total [Enterprise value would be at least 90-95%. This leaves too much room for errors as a valuation of Box may change substantially with a tiny change in assumed WACC and growth rate.
If you are new to Company Analysis, you can look at this Ratio Analysis Excel Case Study to learn more about Fundamental Analysis.
Next Steps?
Anything I missed? Let me know what you think, your feedback by Leaving a Comment
p.s. – I do not represent any brokerage firm. The above views are my assessment of the Box IPO. I have tried my best to ensure the factual accuracy of the analysis; however, please feel free to provide me with corrective measures if you spot any errors.