Part of our Efficiency Ratios guide
Revenue Per Employee?
Revenue Per Employee is the ratio of revenue generated per employee of a company on an average; this ratio gives an idea about how the company will perform in a specific quarter – especially considering the revenue vs. cost of each company employee.
Revenue per Employee Excel Template
Download Excel Template- The revenue per employee indicates the average revenue a single employee generates. It helps predict the company’s performance in a particular quarter, especially when comparing payment and employee costs.
- To better understand, comparing it to the company’s historic ratios over multiple years is essential. For example, it may show whether the ratios are increasing or decreasing.
- It helps track changes in employee productivity levels which is essential. Comparing ratios with peers and past performance helps understand the situation.
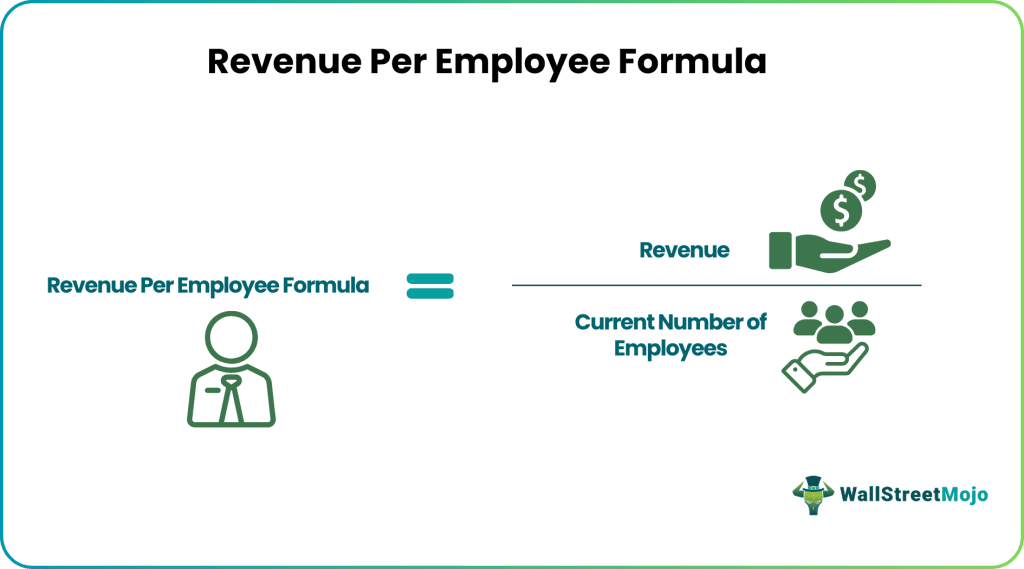
Revenue Per Employee Formula
Revenue per employee is an essential financial ratio calculated by dividing revenues generated for a specific period by the number of employees in a company. It helps as a measure of average financial productivity for each company employee.
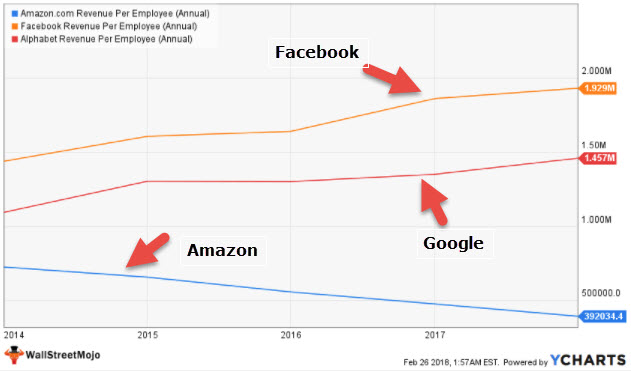
Source: Ycharts.com
This ratio helps determine how productively a company can utilize its employees and contribute to its business growth. Suppose a company has higher revenue per employee formula. In that case, the company is generally doing well and trying to make optimum utilization of the available workforce in its employees. However, labor-intensive companies typically tend to have lower ratios than those who require a lesser amount of labor. It is why, generally, this ratio is employed to compare the performance of companies within an industry.
When we compare this per employee of Facebook, Google, and Amazon, we note that Facebook has the highest annual salary at $1.929 million per employee! Google has this employee of $1.457 million, and Amazon has a revenue of $392,034 per employee.
Video Explanation on Revenue Per Employee

Revenue Per Employee Examples
Example #1
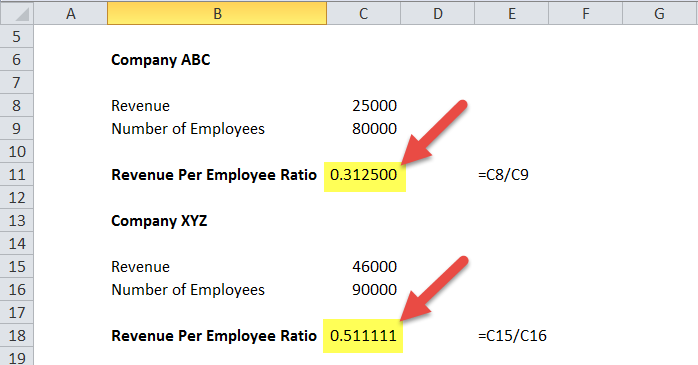
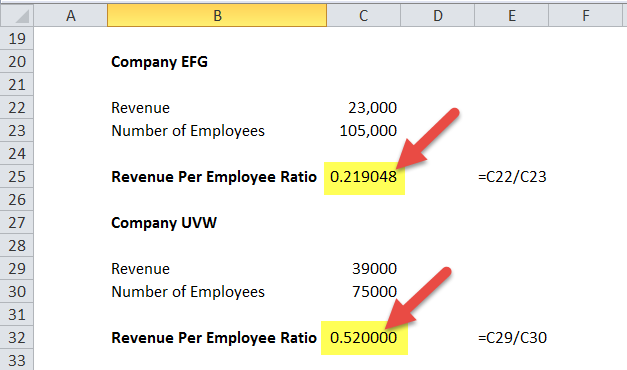
Here, we would consider four firms from the same industry for calculating this ratio and see how they compare against each other.
| Name of Company | Revenues for FY 2017 (in Million US$) | Number of Employees | Sales Per Employee Ratio |
|---|---|---|---|
| Company ABC | 25,000 | 80,000 | 312,500 |
| Company XYZ | 46,000 | 90,000 | 511,111 |
| Company EFG | 23,000 | 105,000 | 219,048 |
| Company UVW | 39,000 | 75,000 | 520,000 |
Based on the sales per employee ratio, Company UVW comes out on top, followed by Company XYZ, Company ABC, and Company EFG in the descending order of ratio values. It broadly indicates which company could best utilize its employees in terms of productive assets during a specific financial year.
Example #2 – Tech Industry
The below table provides you with the details of sales per employee of top Tech companies.
| S. No | Name | Sales Per Employee (Annual) |
|---|---|---|
| 1 | 1,928,831 | |
| 2 | Points International | 1,637,766 |
| 3 | Alphabet | 1,457,056 |
| 4 | VeriSign | 1,199,892 |
| 5 | Criteo | 881,309 |
| 6 | InterXion Holding | 824,043 |
| 7 | Blucora | 730,627 |
| 8 | AutoWeb | 690,238 |
| 9 | 681,914 | |
| 10 | Shutterstock | 665,747 |
- We note that Facebook has the highest sales per employee.
- This list above makes more than half a million sales per employee.
- Interesting to note that Twitter is on the list with $681,914 per employee.
Example #3 – Auto manufacture Industry
Below is the list of top manufacturing companies with their Sales per employee.
| S. No | Name | Sales Per Employee (Annual) |
|---|---|---|
| 1 | Ferrari | 1,100,416 |
| 2 | Ford Motor | 778,045 |
| 3 | General Motors | 718,953 |
| 4 | Tesla | 661,273 |
| 5 | Toyota Motor | 638,522 |
| 6 | Honda Motor Co | 615,978 |
| 7 | Fiat Chrysler Automobiles | 538,122 |
| 8 | Blue Bird | 486,424 |
| 9 | Tata Motors | 406,627 |
| 10 | Kandi Technologies Group | 245,715 |
- We note that Ferrari has the highest sales per employee with approx. Revenue of $1.1 million per employee.
- Fiat, on the other hand, makes around $538,122 per employee.
- The top tech company’s revenue per employee is more than the manufacturing company’s revenue per employee.
Example #4 – Banking Industry
Below is the list of top banks with their revenue per employee, Formula.
| S. No | Name | Sales Per Employee (Annual) |
|---|---|---|
| 1 | East-West Bancorp | 502,428 |
| 2 | UBS Group | 498,720 |
| 3 | Westpac Banking | 493,447 |
| 4 | Credit Suisse Group | 432,640 |
| 5 | Bank of America | 417,952 |
| 6 | JPMorgan Chase | 403,485 |
| 7 | Bank of N.T Butterfield | 401,880 |
| 8 | Royal Bank of Canada | 388,697 |
| 9 | ING Groep | 386,020 |
| 10 | Bank of Montreal | 377,244 |
- Overall, banks also make far fewer sales per employee than the tech industry.
- JPMorgan makes an Annual revenue of $403,485 per employee.
Use and Relevance of Revenue Per Employee Formula
Other Similar Ratios:
Other similar ratios are calculated by dividing net income instead of revenues from the number of employees to try and see how a company fares in employee-based productivity. Revenues are an easily understood term and often used in financial ratio calculations, which helps explain its relevance in calculating this ratio.
Role of Employee Turnover Rate:
It must also be remembered that the employee turnover rate impacts this financial ratio. Employee turnover rate is the percentage of the total workforce that voluntarily leaves a company for a year and needs to be replaced. It should not be confused with employee attrition, which refers to employees who have either retired or were terminated by the company.
The relevance of Sales Per Employee
Keeping in mind all these factors, only the average number of employees is usually utilized for calculating the sales per employee ratio formula. Employee represents a unique asset to a business. If the concept of asset utilization is applied carefully in nurturing employees with a high level of productivity, a company can potentially perform much better than its peers. Such companies tend to have relatively better sales per employee ratios within their specific industry.
How to Use this Ratio?
The ratio by itself is of little use without any frame of reference; hence it should be read against the historic ratios for the same company over several years to see if the ratios are rising or falling. It would help indicate improving or declining levels of employee productivity. Then again, the ratios should be compared with industry peers and how they have performed over the years.
Revenue Per Employee Formula Calculator
You can use the following calculator.
Calculate Revenue Per Employee in Excel (with excel template)
Let us now do the same example above in Excel. It is very simple. You need to provide the two inputs of Revenue and Number of Employees.
You can download this template here – Revenue per Employee Excel Template.
Frequently Asked Questions (FAQs)
What is a good revenue-per-employee ratio?
For companies with less than $1 million in total revenue, a good benchmark for revenue per employee is around $43,000. Companies earning $50 million or more in total revenue should aim for around $230,000 per employee.
Is revenue per employee a good metric?
Calculating the revenue per employee ratio is an important metric that can help you gauge the business’s efficiency and workforce performance.
How can a company improve its revenue per employee?
Companies can improve their revenue per employee through various means, including investing in employee training and development, implementing process improvements, leveraging technology and automation to increase efficiency, focusing on high-value projects or clients, and streamlining operations to reduce overhead costs.
How does revenue per employee relate to employee productivity?
Revenue per employee is directly related to employee productivity. A higher revenue per employee generally indicates that each employee contributes more to the company’s revenue generation, suggesting better productivity. However, it’s important to note that productivity should not be evaluated based solely on revenue per employee, as other factors, such as quality of output and customer satisfaction, also play a role in determining overall productivity.
Recommended Articles
This has been a guide to the Revenue per employee ratio, its uses, and practical examples. Here we also provide you with Sales per employee Calculator with a downloadable excel template.