What Is ROIC -Return On Invested Capital?
Return on Capital Invested Capital (ROIC) is one of the profitability ratios that help us understand how the firm uses its invested capital i.e., equity and debt, generating profit at the end. This ratio is so important for investors before the investment because it gives them an idea about which company to invest in.
Because the percentage of profits generated from the invested capital is a direct ratio of how good a company is doing in transforming its capital into income. While calculating this ratio, one thing you need to remember is whether you are taking the core income of the business (i.e., most of the time, “net income” of the firm) as a measuring grid. The business can generate income from other sources, but it shouldn’t be considered if it’s not from its core operations.
Key Takeaways
- ROIC (Return on Invested Capital) is a profitability ratio that shows how effectively a company uses its capital (debt and equity) to generate profits.
- Investors should consider this ratio, which shows how effectively a company generates income from its invested capital when deciding where to invest.
- This ratio also focuses on the income from operations and may not consider other forms of remuneration. As a result, it is the most accurate way to calculate the profit percentage
ROIC – Return On Invested Capital Explained
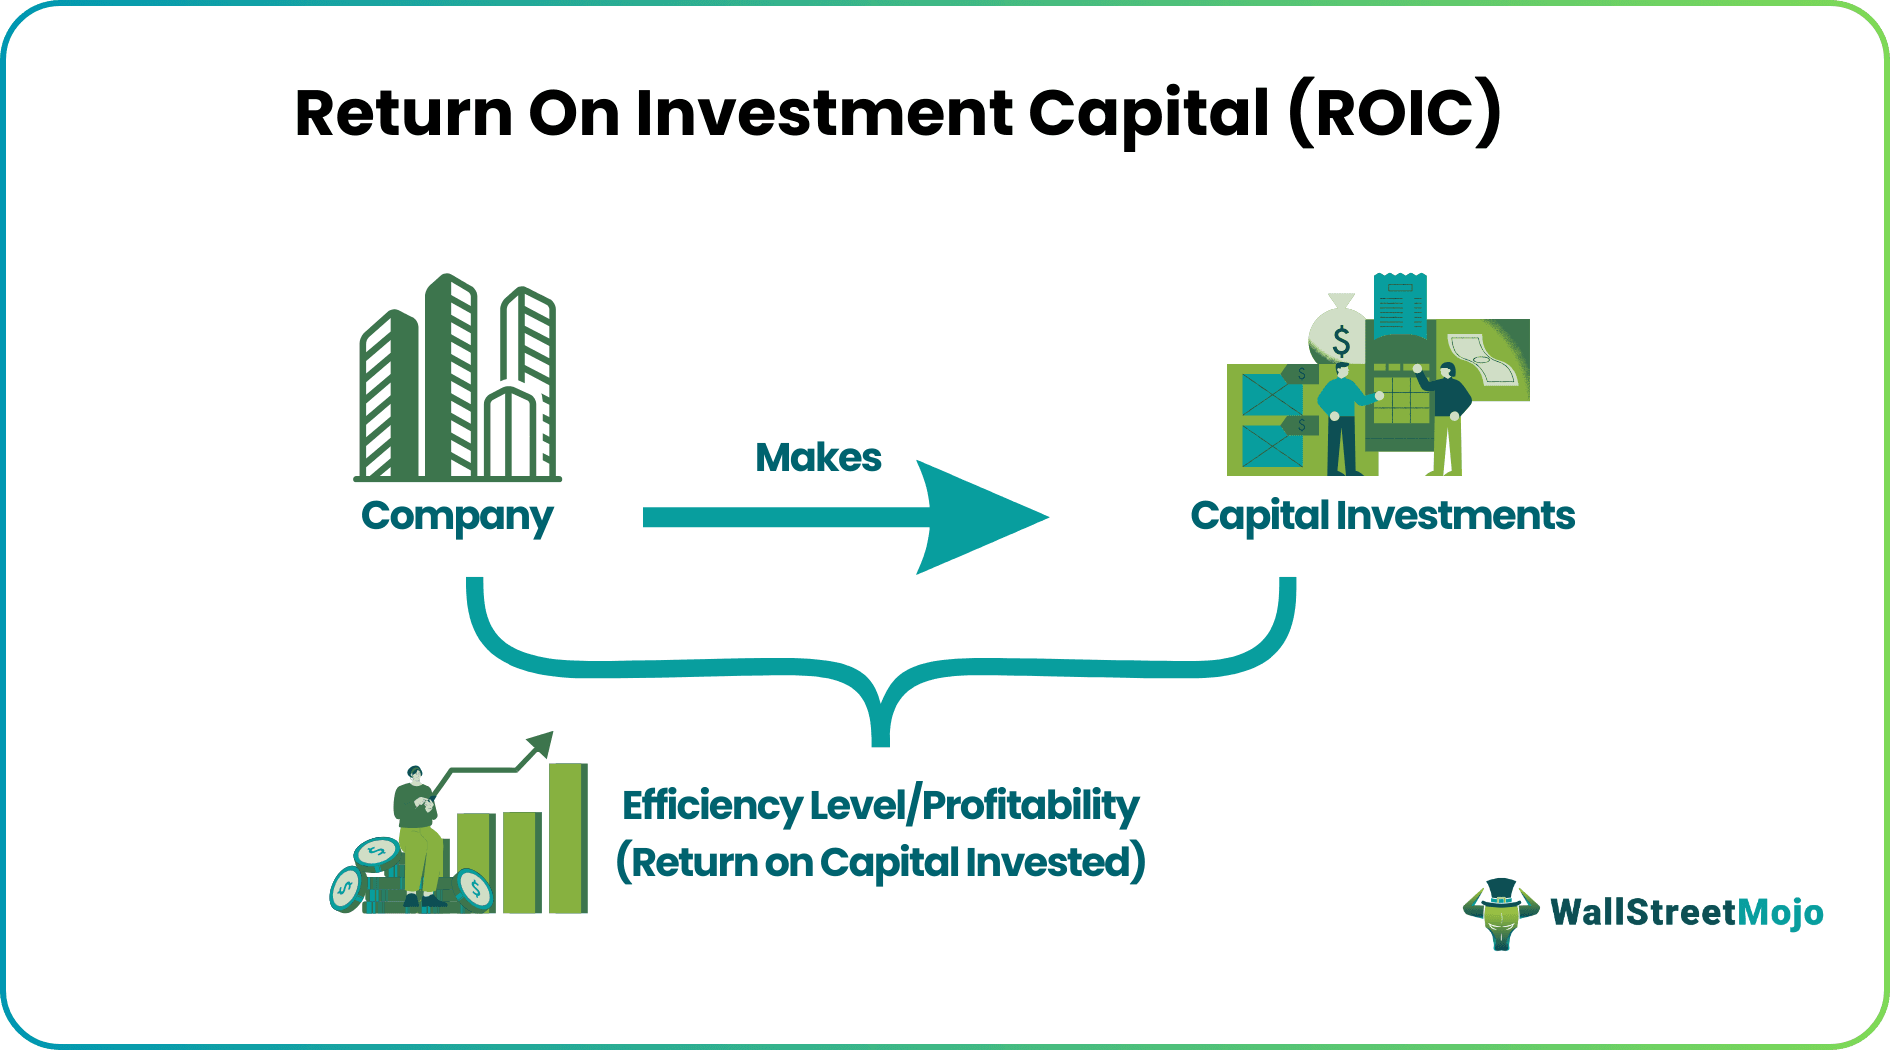
The return on invested capital is the process of measuring the level of efficiency and profitability with which the company uses its capital and generates return for its stakeholders. Thus, it gives an idea to the stakeholders whether their contributed capital is being used effectively and in the optimum manner.
This financial metric calculate return on invested capital considers both debt and equity financing in the process. It is a very comprehensive concept that measures the capital efficiency of a company. This is because it reflects the entire capital structure.
The process gives an insight into the return generation levels and profits earned from them. This also helps in comparing among peer companies within the same sector of industry and select stocks fro investment purpose. Investors can also use this metric for evaluation of future potential of their investment. Potential investors are attracted more towards higher returns.
However, the ROIC may vary from company to company because the risk-taking ability and capital requirements vary depending on the company operations. But mostly companies try to keep it as high possible because high return on invested capital stocks indicate optimum asset usage, efficient management of operations, growth and innovation.
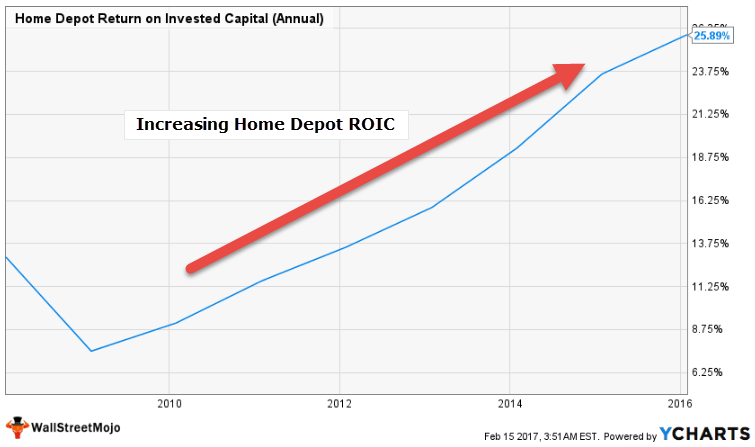
ROIC of Home Depot shows an upward trend and currently stands at 25.89%. What does this mean for the company, and how does it impact the investors’ decision-making process? All these questions will be answered in the article below from the return on invested capital equation.
Formula
Given below is the formula to calculate return on invested capital.
ROIC Formula = (Net Income – Dividend) / (Debt + Equity)
Let’s take each item from the equation and explain what they are.
As a business or as an investor, if you want to calculate this ratio, the first thing you need to consider is Net Income. This Net Income should be coming from the main operations of the business. That means “Gains from foreign currency transactions” or Gains from other currency transactions” wouldn’t be included in Net Income.
If you find too many incomes from other sources, calculate the Net Operating Profit after Tax (NOPAT). You won’t find NOPAT in the financial statements, but you can calculate it by following this simple formula –
Also, have a look at the Ratio analysis Guide.
NOPAT Formula = Operating Income before Tax * (1 – Tax)
Now how would you get the figure of Operating Income? To find out operating income, you need to look into the income statement and find out the operating profit or operating income. Let’s understand this with an ROIC example –
| In US $ | |
| Gross Revenue | 50,00,000 |
| (-) Direct Costs | (12,00,000) |
| Gross Margin (A) | 38,00,000 |
| Rent | 700,000 |
| (+) General & Administration Expenses | 650,000 |
| Total Expenses (B) | 13,50,000 |
| Operating Income before tax [(A) – (B)] | 24,50,000 |
- To calculate NOPAT, all you need to do is deduct the tax proportion from the Operating Income.
- In the case of Dividends, if you have paid any dividend during the year, you need to deduct that from Net Income.
- Debt is what the firm has borrowed from a financial institution or banks, and equity is what the firm has sourced from equity shareholders.
Interpretation
From the explanation, you may have understood that Return on Capital is not an easy ratio to calculate. But irrespective of all these complexities, if you can come up with Return on Capital, it would help a great deal in deciding how the company is doing. Here’s why –
- You are considering net income or NOPAT and how much capital the business has invested. It includes most of the things into account while calculating the ratio. So it produces the right percentage of the profit at the end of the year.
- This ratio emphasizes the income from operations more and doesn’t always include other income. That means it’s the purest form of calculation to ascertain the profit percentage.
Example
Let us understand the concept with the help of some suitable examples.
Example#1
| In US $ | |
| Net Income | 300,000 |
| Shareholders’ Equity | 500,000 |
| Debt | 10,00,000 |
| Shareholders’ Equity | 500,000 |
| Debt | 10,00,000 |
| Invested Capital | 15,00,000 |
| Net Income | 300,000 |
| (-) Dividend | – |
| Invested Capital | 15,00,000 |
| Return on Capital | 20% |
If you find the ROIC of a company more than 20% for the last few years, you may think about investing in the company, but make sure that you consider every figure and detail while calculating this ratio.
Example#2
We will look at Infosys’ income statement and balance sheet for the year-end 2014 and 2015 and then will calculate the ROIC ratio for both years.
Let’s have a look at the Balance Sheet first.
Balance Sheet as of 31st March 2014 & 2015 –

source: Infosys Annual Report
Statement for profit and loss for the year ended 31st March 2014 & 2015 –
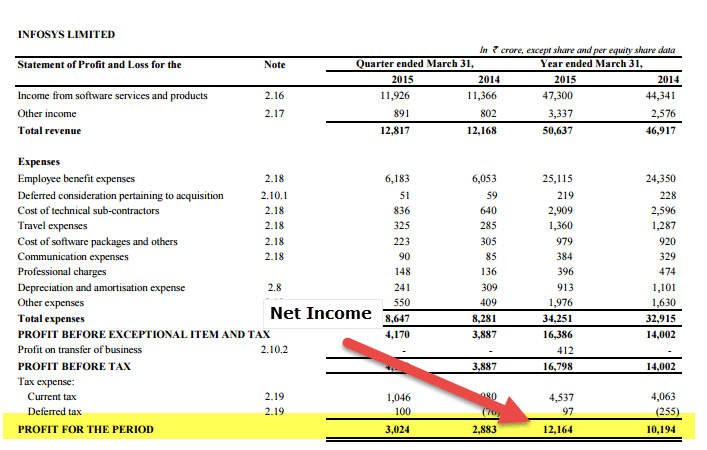
source: Infosys Annual Report
Now, let’s calculate the return on invested capital.
| In Rupees Crores | 31st March 2015 | 31st March 2014 |
| Profit for the year (A) | 12164 | 10194 |
| Capital Invested (B) | 48068 | 42092 |
| Return on Capital | 0.25 | 0.24 |
| Return on Capital (in percentages) | 25% | 24% |
- As there is a negligible amount of other income, we took the real income into account while coming up with the year’s profit. And also, there is no dividend mentioned, so we didn’t deduct the amount from the profit.
- As Infosys is a fully debt-free company, only shareholders’ funds are considered capital invested.
Let’s come to interpret the Return on the Invested Capital ratio for both years. We could easily say that Infosys is a company that has been successful in generating a great Return on Capital for both of the years. So from the investors’ point of view, Infosys may seem a good place to invest their money into because of being one of the high return on invested capital stock.
Example#3
Home Depot is a retail supplier of home improvement tools, construction products, and services. It operates in the US, Canada, and Mexico.
When we look at Home Depot’s ratio, we see Return on Capital of Home Depot has climbed up steeply since 2010 and is currently at 25.89%.
What are the reasons for such an increase?
source: ycharts
Let us investigate and find out the reasons.
Return on Invested Capital ratio can increase either because of an increase in 1) Net Income 2) decrease in Equity 3) Decrease in Debt
# 1 – EVALUATING HOME DEPOT’S Net Income
Home Depot increased its Net Income from $2.26 billion to $7.00 billion, approximately 210% in 6 years. It significantly increased the numerator and is one of the most important contributors to the uptick in ROIC ratio.
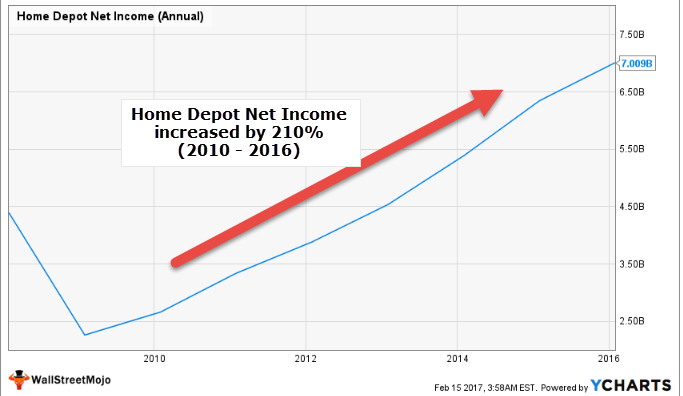
source: ycharts
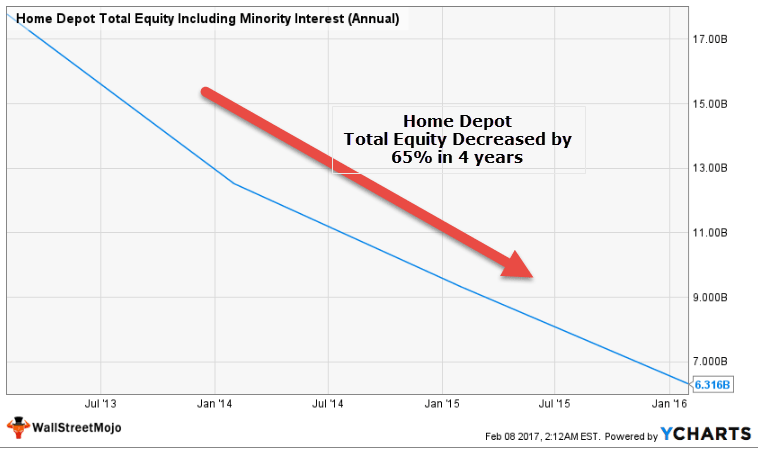
#2 – EVALUATING HOME DEPOT’S SHAREHOLDER’S EQUITY
We note that the shareholder’s equity of Home Depot has decreased by 65% in the last four years. Declining shareholder’s equity has contributed to the decrease in the denominator of the ROIC ratio. We note that the decrease in Shareholder’s Equity has also contributed meaningfully to the increase in the Home Depot ratio.
source: ycharts
If we look at Home Depot’s Shareholder’s Equity section, we find the possible reasons for such a decrease.
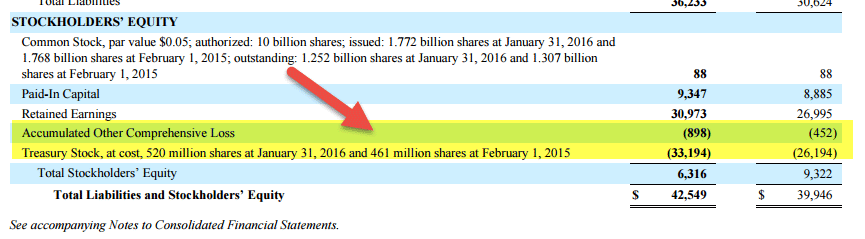
- Accumulated Other Comprehensive Loss has resulted in lowering shareholders’ equity in both 2015 and 2016.
- Accelerated Buybacks were the second and most important reason for the decrease in Shareholder’s equity in 2015 and 2016.
#3 – Evaluating Home Depot Debt
Let us now look at Home Depot’s Debt. Home Depot’s debt increased from 9.682 billion in 2010 to $21.32 billion in 2016. This 120% increase in debt resulted in lowering the ROIC ratio.

source: ycharts
Summary –
We note that Home Depot’s Return on Invested Capital ratio increased from 12.96% in 2010 to 25.89% in 2016 because of the following –
- Net Income increased by 210% in the period from 2010-2016 (a major contributor to the numerator)
- Shareholder Equity decreased by 65% in the corresponding period. (a major contributor to the denominator)
- An overall increase in the ROIC ratio because of the two factors above (1 and 2) was offset by the 120% increase in debt in the corresponding period.
Industry-Wise ROIC Ratios
What is the right benchmark for a great ratio? The answer is it depends!
It depends on the kind of industry it operates into. We can’t compare Amazon’s ratio with Home Depot’s as they operate in a different sector.
Below we have documented some industry Return on an Invested Capital ratios that will help you with the ballpark figures of what seems to be a good ROIC ratio.
Two important points to note here –
- Capital Intensive Sectors like Telecom, Automobile, Oil & Gas, Utilities, Departmental Stores tend to generate low ROIC.
- Pharmaceutical, Internet Companies, Software Application companies tend to generate higher Returns on an Invested Capital ratio.
Let us look at some of the top companies in some important sectors. Please note that the source of Industry Return on the Invested Capital ratio is ycharts.
#1- Departmental Stores Industry
| S. No | Name | Return on the Invested Capital ratio (Annual) | Market Cap |
| 1 | Macy’s | 8.7% | 9,958.7 |
| 2 | Cencosud | 3.2% | 8,698.1 |
| 3 | Nordstrom | 13.0% | 7,689.5 |
| 4 | Kohl’s | 7.9% | 7,295.4 |
| 5 | Companhia Brasileira | 1.1% | 4,900.7 |
| 6 | JC Penney Co | -7.7% | 2,164.3 |
| 7 | Dillard’s | 9.9% | 1,929.0 |
| 8 | Sears Holdings | -58.6% | 685.0 |
| 9 | Sears Hometown and Outlet | -5.6% | 86.3 |
| 10 | Bon-Ton Stores | -6.2% | 24.4 |
- We note the following in the example of the Internet and content industry. We note that Nordstorm has an ROIC ratio of 13%; on the other hand, Macy’s has a ratio of 8.7%
- Many companies like Sears Holding, Bon-Ton Stores, JC Penney Co show a negative Return on Invested Capital ratio.
#2 –Internet and Content Industry
| Symbol | Name | Return on the Invested Capital ratio (Annual) | Market Cap ($ Million) |
| 1 | Alphabet | 15% | 580,074 |
| 2 | 20% | 387,402 | |
| 3 | Baidu | 35% | 63,939 |
| 4 | Yahoo! | -12% | 43,374 |
| 5 | JD.com | -25% | 41,933 |
| 6 | NetEase | 24% | 34,287 |
| 7 | -8% | 11,303 | |
| 8 | VeriSign | 60% | 8,546 |
| 9 | Yandex | 11% | 7,392 |
| 10 | IAC/InterActive | -1% | 5,996 |
- Internet and Content companies are generally not capital intensive like the Utilities or Energy Companies. Therefore, we can see that this industry’s Return on an Invested Capital ratio is higher.
- Alphabet, Facebook, and Baidu have a ratio of 15%, 20%, and 35%, respectively.
- However, Yahoo, JD.Com, and Twitter have a negative Return on Invested Capital.
#3-Telecom Industry
Please see below the list of top Telecom Companies in the US, along with ROIC calculation and Market Capitalization.
| S. No | Name | Return on the Invested Capital ratio (Annual) | Market Cap ($ million) |
| 1 | AT&T | 5% | 249,632 |
| 2 | China Mobile | 12% | 235,018 |
| 3 | Verizon Communications | 10% | 197,921 |
| 4 | NTT DOCOMO | 9% | 88,688 |
| 5 | Nippon Telegraph | 5% | 87,401 |
| 6 | Vodafone Group | -4% | 66,370 |
| 7 | T-Mobile US | 2% | 50,183 |
| 8 | Telefonica | 1% | 47,861 |
| 9 | American Tower | 3% | 45,789 |
| 10 | America Movil | 1% | 42,387 |
We note the following in the ROIC Example of the Telecom industry.
- We note that the Telecom sector is a capital-intensive sector, and its Return on the Invested Capital ratio is on the lower side.
- AT&T, China Mobile, and Verizon have a ratio of 5%, 12%, and 10%, respectively.
- Vodafone Group, on the other hand, have a negative ratio of -4%
#4- Oil & Gas E&P Industry
| S. No | Name | Return on the Invested Capital ratio (Annual) | Market Cap ($ million) |
| 1 | ConocoPhillips | -6% | 61,580 |
| 2 | EOG Resources | -21% | 57,848 |
| 3 | CNOOC | 4% | 55,617 |
| 4 | Occidental Petroleum | -2% | 51,499 |
| 5 | Anadarko Petroleum | -10% | 38,084 |
| 6 | Pioneer Natural Resources | -4% | 33,442 |
| 7 | Canadian Natural | -1% | 33,068 |
| 8 | Devon Energy | -47% | 23,698 |
| 9 | Apache | -88% | 21,696 |
| 10 | Concho Resources | 1% | 20,776 |
- We note that the Oil & Gas sector is highly capital intensive and has a lower ROIC ratio.
- A slowdown in the Oil & Gas sector since 2013 has led to declining profitability and losses in most cases.
- Of these top Oil & Gas companies, eight companies have a negative ratio.
- Only two companies, CNOOC and Concho resources, have a positive Ratio of 4% and 1%, respectively.
#5- Automobile Industry
| S. No | Name | Return on the Invested Capital ratio (Annual) | Market Cap ($ million) |
| 1 | Toyota Motor | 6% | 170,527 |
| 2 | Honda Motor Co | 2% | 57,907 |
| 3 | General Motors | 8% | 53,208 |
| 4 | Ford Motor | 3% | 49,917 |
| 5 | Tesla | -25% | 45,201 |
| 6 | Tata Motors | 7% | 25,413 |
| 7 | Fiat Chrysler Automobiles | 1% | 18,576 |
| 8 | Ferrari | 10% | 16,239 |
- Again, the Automobile Sector is highly capital intensive, and we note that most companies show a lower ROIC ratio.
- Toyota Motors, Honda Motor, and General Motors have a ratio of 6%, 2%, and 8%, respectively.
- Tesla, on the other hand, has a negative ratio of -25% which does not suggest a good return on invested capital.
#6- Utilities Industry
| S. No | Name | Return on the Invested Capital ratio (Annual) | Market Cap ($ million) |
| 1 | National Grid | 6.8% | 47,002 |
| 2 | Dominion Resources | 4.7% | 46,210 |
| 3 | Exelon | 1.9% | 46,034 |
| 4 | Dominion Resources | 4.7% | 31,413 |
| 5 | Sempra Energy | 5.0% | 26,296 |
| 6 | Public Service Enterprise | 7.6% | 22,138 |
| 7 | FirstEnergy | 1.7% | 13,012 |
| 8 | Entergy | -0.7% | 12,890 |
| 9 | Huaneng Power | 5.4% | 10,522 |
| 10 | AES | 2.6% | 7,699 |
- As pointed out earlier, Utilities are also an intensive capital sector and have a lower ROIC ratio.
- National Grid, Dominion Resources, and Exelon have a ratio of 6.8%, 4.7%, and 1.9%, respectively.
- Entergy, on the other hand, has a negative ratio of -0.7%
Limitations
- The ROIC ratio is very complex to calculate. When they need to calculate the return on invested capital ratio, investors can approach it from a different angle. They can calculate the capital invested by deducting the non-interest-bearing-current-liabilities (NIBCLS) from the total assets or considering the short-term debt, long-term debt, and equity. And to calculate the Net Income, there are many approaches they can take. The only thing that needs to be remembered is that the core focus of net income is the income from the business’s operations, not other income.
- This ratio is not suitable for people with no financial background. They often wouldn’t understand the intricacies of this ratio until they had a basic knowledge of finance.
Return On Invested Capital Vs Return On Capital Employed
Both the above financial concepts are interlinked but are different from each other in certain respects. Let us study the differences between them.
- The most important different lies in the measure of profits. The former takes into account the NOPAT, that considers both taxes and operating profits, but the latter uses EBIT, which does not account for either interest or tax. Due to this, the result and interpretation of both will vary.
- As an extension of the above difference, the return on invested capital equation has an impact of taxes in it whereas the latter does not.
- Similarly, the former also consider the impact of interest in it along with taxes unlike the latter.
- Therefore, ROIC is considered to be a comprehensive measure and gives more clarification of the utilization of funds in the business. But ROCE is consider to focus more on the profitability of the business operations.
However, the company selection based on good return on invested capital will depend on why the analysis will be done and the type of business operations.
Return on Invested Capital (ROIC) Video

Recommended Articles
Frequently Asked Questions (FAQs)
Is ROIC a percentage?
When calculating ROIC, it is important to express it as a percentage and use either an annualized or trailing 12-month value. This figure should then be compared to the company’s cost of capital to assess whether the company is generating value.
How can a company improve its ROIC?
Companies can improve their ROIC by implementing strategies that enhance profitability and capital efficiency. Therefore, this may include focusing on high-return projects, optimizing operating expenses, reducing debt, improving asset turnover, and making wise investment decisions.
Can ROIC be negative?
When a business invests its funds in ways that do not deliver positive returns, it is called a negative ROIC. However, it is essential to note that a low or negative ROIC is sometimes a good thing, as previously stated.
Is ROIC the same as ROI?
The ROIC considers the company’s profit-generating activities, while the ROI focuses on a specific action. To calculate the ROI, you divide the profit from that activity (minus the cost) by the investment cost.
In the final analysis
After discussing everything in detail, we conclude that this article is a guide to what is Return On Invested Capital. We explain the differences with ROCE, formula, examples, industry-wise ratios & interpretation. If the Return on Invested Capital ratio can be followed over the years, it would certainly give a clear picture of how a firm is doing. Thus, if, as an investor, you want to invest your money into a firm, calculate Return on Invested Capital first and then decide whether it’s a good bet for you or not.