Part of our Profitability Ratios guide
What is Return on Average Assets?
Return on Average Assets (ROAA) extends the ratio of Return on Assets. Instead of the total assets at the end of the period, it takes an average of the opening and the closing balance of assets for some time. It is calculated as Net earnings divided by Average total assets (beginning plus ending of assets divided by two).
Return on Average Assets Excel Template
Download Excel TemplateHere’s the formula –
In the above ratio, there are two components.
- The first component is net income. If we can look into the company’s income statement we will be able to find the net income. Net income is the last item in the income statement. When we deduct the taxes from PBT (profit before taxes), we get the Profit after Tax (PAT) or net income.
- The second component in the ratio is the average total assets. To find out assets, we need to look into another company’s financial statement, i.e., the balance sheet. We will find both the current assets and non-current assets in the balance sheet. To find out the average total assets, we need to consider total assets at the beginning and end. And then, we need to add the beginning, total assets, and the total ending assets and then divide the sum by two to get a simple average.
- Return on average assets is a metric that, instead of using the average assets used by a firm in a year, uses the closing and opening balances of the firm to calculate the return on average assets.
- The formula used to calculate ROAA is net income divided by the total average assets of the firm and is an assessment to comprehend the firm’s profitability.
- If ROAA is on a decline, the firm is generally more asset-intensive. Whereas companies with an increase in ROAA means the firm is less asset-intensive.
- Analysts use this ratio to compare companies in similar industries to see how it is thriving financially and to measure their creditworthiness.
Example
Let’s take a simple example to calculate the ROA formula.
Eye Lash Co. has the following information –
- Net Income – $150,000
- The beginning total assets – $500,000
- The ending total assets – $400,000
Find out the ROAA.
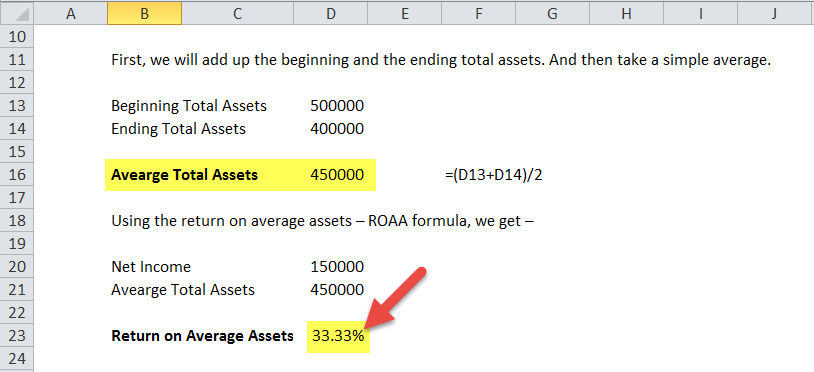
First, we will add up the beginning and the total ending assets. And then take a simple average.
- The average total assets = ($500,000 + $400,000) / 2 = $450,000.
Using the formula, we get –
- ROAA = Net Income / Average Total Assets
- Or, = $150,000 / $450,000 = 1/3 = 33.33%.
Return on Average Assets Video Explanation

Use of ROAA Formula
Let’s understand the application of the ROAA formula from two points of view.
- For investors, it is important to know whether the company is financially strong or not. They use the ROA formula to see how well the company is utilizing its assets.
- If the ROA is lower, it is easily understood that the company is a higher asset-intensive company. On the other hand, if the ROAA is taller, the company is lower asset-intensive.
- Investors need to look at the industry before interpreting the ratio; because a higher asset-intensive industry will always result in lower ROAA for the company and vice versa.
- For the management, this ratio is also important because the ratio can talk a lot about the company’s performance; and by comparing the ratio with similar companies under the same industry, management would be able to understand how well the company is doing.
Return on Average Assets Calculator
You can use the following calculator.
Return on Average Assets in Excel (with excel template)
Let us now do the same example above in Excel. This is very simple. You need to provide the two inputs of Net Income and Average Total Assets.
You can easily calculate the ratio in the template provided.
You can download this template here – Return on Average Assets Excel Template.
Return on Average Assets ROAA Formula Video
Frequently Asked Questions (FAQs)
What is considered to be a good return on average assets?
A good return on average assets would be 5%. Analysts use this to gauge firms’ performance and credibility to better understand whether the company is healthily utilizing the assets.
What is the relationship between return on investments and return on assets?
Return on assets is a part of the return on investments to understand the business’s prosperity based on the company’s total assets.
Why is ROAA important for commercial banks?
ROAA is essential for banks to delimit the difficulty encumbered while constructing the company’s financials, which indicates the per-dollar price for the assets in use.
Recommended Articles
This article has been a guide to the return on average assets formula, its uses, and practical examples. We also provide you with an ROAA calculator with a downloadable excel template. You may also look at these articles below to enhance your financial analysis learnings.