What is Stock Turnover Ratio?
The stock turnover ratio is the cost of goods sold divided by average inventory and it determines how soon an enterprise sells its goods and products and replaces its inventories in a set duration. This ratio helps improve inventory management by informing business about the speedy or sluggish flow of inventory being utilized to create sales.
Also known as the inventory turnover ratio, the figure lets companies learn how efficiently they are turning the inventory into real sales. The higher the ratio, the better it is as it indicates that the growth and performance of an organization is positive.
Key Takeaways
- The stock turnover ratio shows how fast a company sells and replaces inventory. To calculate it, divide the cost of goods sold by the average list. This ratio helps businesses manage inventory and track sales rates.
- A high stock turnover ratio can indicate strong demand and quick sales but may also result in missed sales opportunities and supplier price increases.
- Low stock turnover could mean poor capital management or a strategy to accumulate inventory. However, the stock turnover ratio has limitations as a financial measure.
Stock Turnover Ratio Explained
The stock turnover ratio allows businesses to check how frequently they are turning their purchased stock or inventory convert into sales. When the figure obtained in this case is high, it reflects the business is proceeding in the right direction. However, the lower ratio warns them to be more specific with the sales strategies they apply and implement.
Keeping track of the inventory is a crucial affair for any business as the shortage of it leads to lots of issues, including the loss of market reputation that it might hold. When such a ratio is calculated and used as a metric, the business knows when to order more stocks based on how frequently customers are purchasing their products.
An ideal turnover ratio is 5 and 10, which signifies that the stock refilling needs to be done every month or two.
Formula
The formula that helps to calculate the ratio is:
Stock Turnover Ratio Formula = Cost of Goods Sold /Average Inventory
Where,
- The cost of goods sold equals Opening stock + Purchases Less Closing Stock.
- The cost of sales can replace the cost of goods sold.
- Average inventory is the mean of opening stock and closing stock. If opening stock detail is not available, we can take closing stock as well.
How To Calculate?
There is a series of steps to be followed for the calculation of the stock turnover ratio. Let us have a quick look at them:
It can be calculated using the below steps:
- For a company, the cost of goods sold (i.e., COGS) is a yardstick for the production costs of services and goods. The cost of goods sold shall include labor costs, which are directly related to stock produced, materials, and any other fixed costs or factory overhead, which are directly used for producing those goods.
- The average stock needs to be computed as firms might carry lower or higher stock levels at a certain period during the year. E.g., Retailers such as Best Buy Co. Inc. might carry higher stock, which leads to the holidays in Quarter four and lower stock levels in Quarter one post those holidays.
- Dividing COGS by average stock will calculate the stock turnover ratio.
Examples
Let us consider the following simple to advanced practical examples to understand the stock turnover ratio meaning and calculation better
Example #1
Suppose Company C had an average inventory of $1,145,678, and the cost of goods sold during the same period was $10,111,987. You are required to calculate the stock turnover ratio.
Solution
Use the following data –
- Cost of Goods Sold: 10111987.00
- Average Inventory: 1145678.00

- = 10,111,987 /1,145,678

- = 8.83 times
It means the stock rotates eight times.
Example #2
Cisco is a brand name for toothpaste in country I. The company has taken a cash credit loan from the Bank of Picco. The company must submit monthly stock and debtors’ details with aging on the same. Also, the company is required to submit a certain ratio, including the stock turnover ratio. The details from the company’s profit and loss statement are per below-

Based on the above details, you must calculate the Inventory Turnover Ratio.
Solution
In this example, we are given a profit and loss statement, and we need to figure out the cost of goods sold and average inventory as well.
Calculation of Cost of Goods Sold

Cost of Goods Sold=Opening Stock + Net Purchases – Closing Stock
= 3,500,000 + ( 21,350,000 – 320,250 ) – 4,200,000
- Cost of Goods Sold = 20,329,750
Calculation of Average Stock

Average Stock = ( Opening Stock + Closing Stock ) / 2
= ( 3,500,000 + 4,200,000 ) / 2
- Average Stock = 3,850,000
Calculation can be done as follows,

- =20329750.00/3850000.00
Stock Turnover Ratio will be –

- = 5.28 times
It means the stock rotates 5.28 times.
Example #3
Company X is trying to evaluate three products currently selling in the market. It wants to analyze which one of the products is slow-moving and which one is the fast-moving goods. On reviewing the details of the three products, below is the summary created by the finance department.
| Particulars | Product 1 | Product 2 | Product 3 |
|---|---|---|---|
| Average Revenue Earned | 42000000.00 | 56000000.00 | 49000000.00 |
| Gross Profit Margin | 25.00% | 20.00% | 22.00% |
| Closing Stock | 5250000.00 | 5000000.00 | 6625000.00 |
Based on the above information, you must advise the management which goods are fast-moving and slow-moving?
Solution
In this example, we are given Average Revenue and closing stock. Since there is no opening stock information, we can take closing stock as a proxy for our computation purposes. Further, we are also not given purchases, and hence we cannot calculate the cost of goods sold with that formula. Still, instead, we are given a Gross profit margin, so if we deduct the gross profit margin from revenue, we will get the cost of sales, which we shall use in the below formula.
Stock Turnover Ratio formula = Cost of goods sold or cost of sales /Average Inventory or Closing stock
Cost of Sales Margin For Product 1

=1-25.00%
- Cost of Sales Margin = 75.00%
Similarly, we can calculate the cost of sales margin for products 2 and 3

Cost of Sales

- =42000000.00*75.00%
- Cost of Sales = 31500000.00
Likewise, we can calculate the cost of sales for products 2 and 3

The calculation can be done as follows,
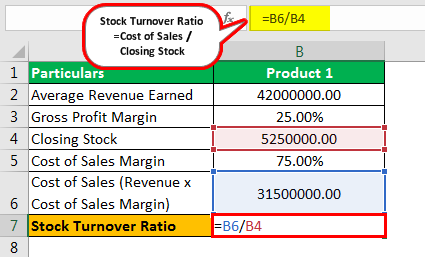
=31500000.00/5250000.00
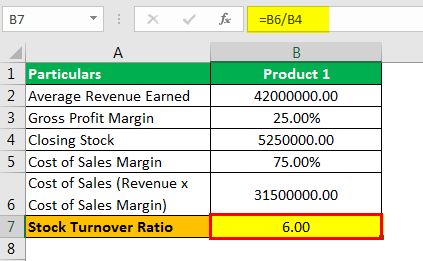
- = 6.00
Similarly, we can calculate the stock turnover ratio for products 2 and 3

Using this ratio, product 2 is fast-moving as it has the highest turnover ratio and product 3 is comparatively slow-moving goods, which is 5.77 versus 6 for product 1. Further, the gross profit margin of Product 1 is better than Product 3; subsequently, it is wise to choose to shut down Product 3 if the company is taking such a decision.
Example #4 – Walmart Stock Turnover Ratio
What is the inventory turnover for the company? Walmart, the US retailer giant, is an example of the best inventory management system. Below is the Statement of financial position and Income statement for Walmart.
Source: WalMart Annual Report
The cost of goods sold can be found in the income statement above. And the average inventory can be calculated by taking the year-end inventories for FY 2019 and FY 2018.

Hence, Average inventory = Average of $44,269 and $43,783 = $44,026
Dividing Cost of goods sold by the average inventory,

We get a stock turnover of 8.75.
Inference: Walmart turned over its inventory 8.75 times in FY2019 to generate sales corresponding to the cost of goods sold, equating to $385,301. A high turnover ratio is desirable for Walmart because of its retail business, where observed high inventory turnover ratios.
Interpretation
The higher the stock turnover ratio, the better it is, and it means the company sells that product very quickly, and demand also exists for that product. A higher ratio may also mean that the company is missing sales opportunities as it’s not carrying adequate stock. It might also mean that the company is frequently purchasing. It can also put the business in difficulty if prices from the suppliers’ end rise.
When the stock turnover is low, it would mean outdated inventory or slow-moving goods. It can be a signal toward inefficient working capital management. Nevertheless, it can be a strategy of stock building done knowingly.
Uses
When it comes to understanding the significance of the stock turnover ratio, its uses need to be studied. Here is a list of instances where the calculation of this ratio serves useful:
- It helps analyze and compare how efficiently a business converts its inventory to sales with respect to the set industry standards.
- The ratio obtained lets businesses know how liquid they are. If the ratio is high, it indicates the company is more liquid.
- Higher liquidity depicts that a company has enough cash available to meet its financial requirements and obligations.
Problems
Stock turnover ratio is a critical measure for a company and is widely used in financial analysis; however, it has certain limitations. Let us have a look at a few of them:
- Stock turnover cannot be relied upon completely to draw comparisons among peers without regard to certain similarities. A manufacturing business can find its inventory turning over slower than a restaurant business.
- A high turnover, which is, on the one hand, good for analysts, can have a discerning side when the firm sees more cash tied-up in the system than a low turnover operation.
Frequently Asked Questions (FAQs)
Should the stock turnover ratio be high or low?
A higher ratio is usually a good sign as it indicates strong sales, while a lower percentage may suggest weak sales or decreasing market demand for the goods.
What is the four in-stock turnover ratio?
The company’s inventory ratio of 4 indicates that its inventory was sold and replaced four times in the last quarter. Therefore, despite having a higher inventory turnover rate, it falls within the acceptable range for an e-commerce business.
What is a stock turnover ratio used for?
racking the stock turnover is crucial for owning a business that sells or manufactures products using raw materials. This metric indicates how frequently your products are sold over some time. The quicker one buys, deals, and replaces the stock, the more efficiently the business operates.
Can the stock turnover ratio be different for different industries?
Yes, the stock turnover ratio can vary significantly between different industries. Some industries, such as retail or fast-moving consumer goods, tend to have higher stock turnover ratios due to the nature of their businesses. On the other hand, industries dealing with high-value or specialized products may have lower stock turnover ratios.
Recommended Articles
This article has been a guide to what is Stock Turnover Ratio. We explain its formula, and how to calculate along with examples, interpretation, problems, and uses. You can learn more about financial analysis from the following articles –