Part of our Capital Budgeting guide
Break-Even Analysis Definition
Break-even analysis refers to the identifying of the point where the revenue of the company starts exceeding its total cost i.e., the point when the project or company under consideration will start generating the profits by the way of studying the relationship between the revenue of the company, its fixed cost, and the variable cost.
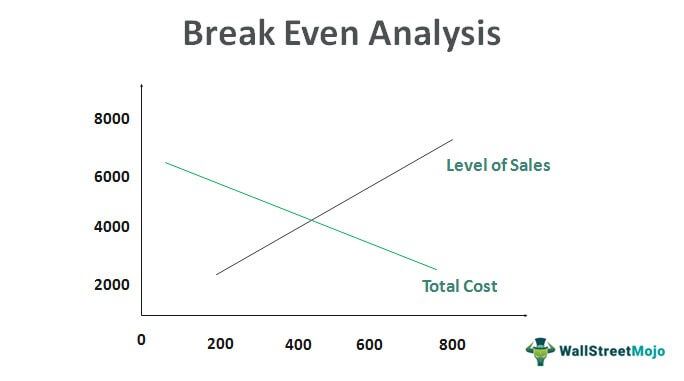
It determines what level of sales is required to cover the total cost of business (Fixed as well as variable cost). It shows us how to calculate the point or juncture when a company would start to make a profit. It is also considered as a measure for the margin of safety. It is used broadly, be it the case of stock and options trading or corporate budgeting for various projects.
Break-Even Analysis Explained
Break-even analysis in business plan is a financial metric that any company uses to determine the level at which its total revenue will be able to cover its total cost of production. At this level, the company will be in a no profit and no loss situation. This metric helps the business to identify which is that production level which ensures that the total cost of production is covered.
Thus, it tells us at what level the investment has to reach so that it can recover its initial outlay.
Break-even analysis is very important for any organization so that it can know its overall ability to generate profit. Suppose for any company if its break level is coming near to the maximum sales level, which the company could reach, then it is impractical for that company to earn profit even in the all-positive scenario. Therefore, it is the responsibility of the management that it should monitor the organization breakeven point constantly as it helps in cost-saving and resulting in a decrease of the breakeven point.
Break-even analysis in business plan plays a very crucial role in decision making process of the management related to pricing, production level, sales level, marketing strategies, budgeting, etc. It is a guide for calculating the margin of safety of the production process, based on revenue and cost. It is important to note that this analysis is widely used in the financial market, not only for manufacturing process, but also for trading purposes, which can be in stocks, options, or investment in projects.
Formula
There are two approaches to calculate the break-even point. One can be in quantity termed as break-even quantity, and the other is sales, which are termed as break-even sales.
In the first approach, we have to divide the fixed cost by contribution per unit i.e.
- Where, Contribution per Unit = Selling Price per Unit – Variable Cost per Unit
In the second approach of break even analysis method, we have to divide the fixed cost by contribution to sales ratio or profit-volume ratio i.e.
- Where Contribution Margin Ratio = Contribution per Unit / Selling Price per Unit
Example
Let us understand the concept of break even analysis method with the help of some suitable examples.
Example 1
Suppose XYZ Ltd is expecting to sell 10,000 units at a price of $10 each. The variable cost associated with the product is $5 per unit, and the fixed cost is coming $15,000 per year. Do the break-even analysis for the given case.
Solution:
Use the following data for the calculation of break-even analysis.

The break-even situation for the given case can be calculated in either quantity terms or in dollar terms.
Calculation of Break-Even Point can be done as follows –

To calculate the Break-Even Point (Quantity) for which we have to divide the total fixed cost by the contribution per unit.
- Here, Selling Price per unit = $10
- Variable Cost per unit = $5
- So, Contribution per unit = $10 – $5 = $5
- Hence Break-Even Point (Quantity) = $15000 / $5 units
Break-Even Point (Quantity) = 3000 Units
It means by selling up to 3000 units, XYZ Ltd will be in no loss and no profit situation and will overcome its fixed cost only. Selling quantity beyond 3000 will help in earning a profit, which will be equal to the contribution per unit for every additional unit sold beyond 3000.
Calculation of Break-Even Sales can be done as follows –
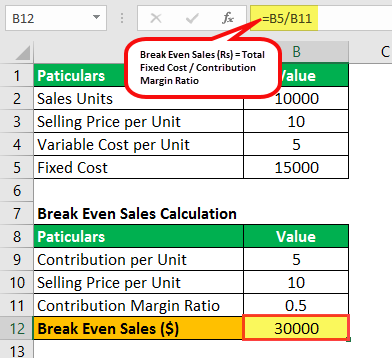
To calculate the Break Even Sales ($) for which we will divide the total fixed cost by the contribution margin ratio.
- Here contribution per unit = $5
- Selling price per unit = $10
- So, contribution margin ratio = $5 / $10 = 0.5
- Hence Break Even Sales ($) = $15000 / 0.5
Break Even Sales ($)= $30,000
It means by selling up to sales value of $30,000, XYZ Ltd will be in breakeven point and will overcome its fixed cost only and will earn profit equal to the sales value beyond $30,000 equal to contribution margin * Sales value beyond $30,000.
Example #2
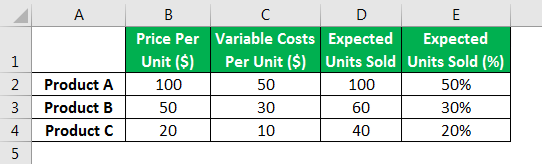
Let us take the case of a multiproduct company producing three different kinds of products named A, B, and C and try to find the breakeven number of units. The following table gives a breakdown of the price, variable costs, and the expected number of units to be sold and let us assume the fixed cost to be $6,600.
In this case, we need to find the weighted average sale price, which is derived as follows,
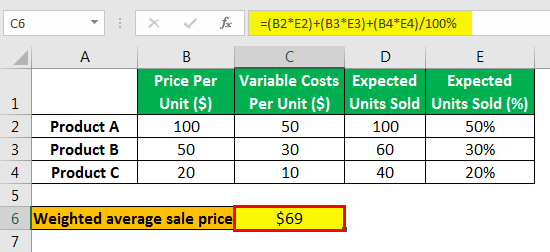
- Weighted average sale price = {(100*50%)+(50*30%)+(20*20%)}/(100%)
- = $69
Similarly, the weighted average sale price for the variable cost is calculated as follows,

- Weighted average sale price = {(50*50%)+(30*30%)+(10*20%)}/(100%)
- = $36
So Breakeven number of units using the above formula is,

- Breakeven Units = $6,600 / ($69 – $36)
- = 200
Accordingly, the breakeven numbers for Product A are 50% of 200 that is 100 and similarly for Product B, and Product C will be 60 and 40, respectively.
Now let us delve into a real-life example and try to apply this concept.
Example #3
Let us try to find the number of units needed to be sold by General Motors’ automotive division to breakeven.
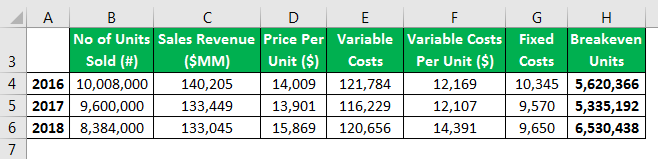
Source: Company disclosures.MM stands for million.
First, let us give you a brief idea of what these numbers from General Motors’s Annual Report (or 10K) signify. For the number of units, we have taken the worldwide vehicle sales.
For 2018 the number of vehicles sold worldwide is 8,384,000 units.
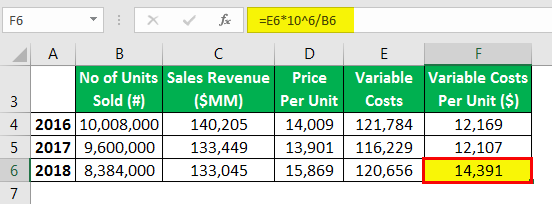
For the deriving price per unit, the ideal way would have been to calculate a weighted average price of each model of vehicles with different selling price (e.g., Chevy and Le Sabre and many more have different prices). Since that would require extensive analysis, we have just used sales revenue as a proxy and divided it by a total number of units to derive the price per unit. The gross sales for 2018 were $133,045MM, which, when divided by 8,384,000, gives a price per unit of $15,869.

For variable costs per unit, we divided the line item “Automotive and other costs of sales” with the number of units sold. The Automotive and other costs of sales or variable costs for 2018 were $120,656MM, which, when divided by 8,384,000, gives a variable cost per unit of $14,391.
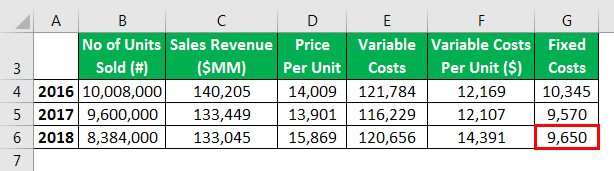
Finally, we took the line item “Automotive and other selling, general and administrative expense” as a proxy for the fixed cost related to the automotive division. For 2018 the Automotive and other selling, general, and administrative expense or fixed costs was $9,650MM.
Now it is very easy to calculate the breakeven and to use the formula defined at the beginning of the break-even analysis case study.

- Breakeven Units = 9,650*10^6 / (15,869 – 14,391)
- = 6,530,438 units.
An interesting thing to note is that although the number of units the company is currently producing is almost 1.3 times the number of units General Motors is currently selling, there has been a steady decline in the number of units sold worldwide. We can also see the number of units to be sold for General Motors to breakeven has increased in 2018, which may be due to the increase in variable cost per unit.
Assumptions
Let us look at the assumptions of the concept in details.
- It assumes that there is no change in the fixed cost. However, this may change due to changes external and internal factors, like inflation, change in income, etc.
- Break-even analysis for service business or manufacturing business, takes into account a constant selling price that does not vary inspite of change in production levels or sales. Selling price may change due to market conditions or competition or sales promotion, etc.
- The variable cost is assumed to be linear with the production, which also means that the variable cost is constant. However, in reality, it will change or exhibit economies and diseconomies of scale.
- The concept assumes total sales and there is no remaining inventory, which is very unlikely in a real production process.
- The analysis remains simple with the assumption that the company produces only one product or service. But the concept will become complicated if multiple products and services are produced, which is the reality in the market.
- Factors like interest or tax expense is not taken into account in this concept, which are actually important factors while considering important decision related to production or investment.
- The theory of break-even analysis for service business or manufacturing business also accounts for a stable condition of the market which means there is no economic fluctuations of change in customer taste preference, etc. This is qiote unlikely in the actual market.
Advantages
Some of the advantages of break-even analysis are as follow:
- Catches Missing Expenses: One has to figure out all the committed cost as well as the variable cost while reviewing the financial commitment to figure out the breakeven point and in this way, some missing expenses which are caught out.
- Set Targets for Revenue: As and when the break-even analysis is complete, one comes to know their projected sales revenue so as to earn the projected profit, and it also helps sales teams to set more concrete goals.
- Powerful Decision Making: As the top management has more defined data, it will help them in good decision making to expand the business or taking any new contract by offering a good minimum price by considering the sunk cost.
Limitations
Some of the disadvantages of break-even analysis case study are as follow:
- Unrealistic assumptions as the selling price of a product can’t be the same at different sales levels,s and some fixed costs might vary with the output.
- Sales can’t exactly be the same as to that of production. There can be some closing stock or wastage as well.
- Businesses selling more than one product: It will be tough to analyze break-even as apportioning of fixed cost among two products will be a challenging one.
- Variable product or services cost will not always remain the same. As the level of output will increase one’s bargaining power to procure material or service will also increase.
- It is a planning aid and not a decision-making tool.
Break- Even Analysis Vs Cost-Volume-Profit (CVP) Analysis
Both are equally important financial tools to understand the cost, price, sales, profitability, etc. But there are some difference between them as follows:
- The former is a part of CVP. But CVP is a broader technique that not only includes the former but also analyses the impact of change in cost, products, prices, etc on the profitability.
- The main purpose of the former is to determine the minimum production and sales level that will cover the cost but the purpose of the latter is to provide a total view of the effect of changes of various factors on sales and profitability.
- The former is a very straightforward and simple approach whereas the latter involves various scenarios and used for complex decision making.
- Usually small business and startups use the former because they aim to at least start covering the costs and establish their business. But big corporations usually use the latter due to their huge size of business operation and complex financial planning.
Thus, the following are some of the differences between the two concepts but both are widely used in the financial market.
Recommended Articles
This has been a guide to Break Even Analysis & its definition. We explain its formula with examples, limitations, advantages & assumptions. You can learn more about accounting from the following articles –