Z Score Formula Meaning
The Z score formula is an expression that helps calculate the score generated by measuring how many standard deviations are above or below the population mean. It helps in testing the hypothesis under consideration. In other words, the distance of a data point from the population is a multiple of the standard deviation.
The equation for the Z-score of a data point is calculated by subtracting the population mean from the data point (referred to as x). Then the result is divided by the population standard deviation.
Key Takeaways
- The Z-score of raw data is the score created by estimating how many standard deviations are above or below the population mean. In addition, it helps to test the hypothesis under consideration.
- The Z-scores vary from -3 times the standard deviation to +3 times the standard deviation (far right of the normal distribution).
- The equation for the Z-score of a data point is calculated by eliminating the population mean from the data point, which is referred to as x. Then, it is divided by the population standard deviation.
- From the hypothesis testing point of view, the Z-score is vital to understand since it is applied to test whether or not a test statistic comes in the acceptable range.
- One may also use it to standardize data before determining and calculating the probability score or comparing two or more data points from various normal distributions.
Z Score Formula Explained
The Z score formula results range from -3 times to +3 times. The Z-scores with -3 times the standard deviation indicate deviation to the far left of the normal distribution. On the other hand, the figure with +3 times the standard deviation denotes deviation to the far right of the normal distribution.
The Z-scores have a mean of 0 and a standard deviation of 1.
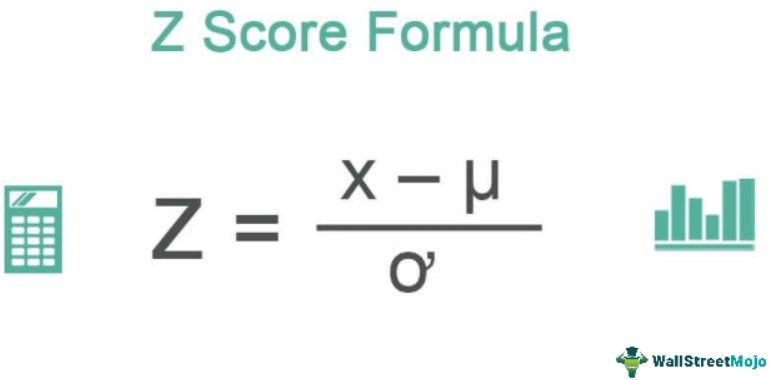
where
- x = Datapoint
- μ = Mean
- ơ = Standard deviation
The equation for the Z-score of a data point derives by using the following steps:
- Step 1: Firstly, determine the mean of the data set based on the data points or observations, which are denoted by xi, while the total number of data points in the data set denotes by N.

- Step 2: Next, determine the standard deviation of the population based on the population mean μ, data points xi, and the number of data points in the population N.

- Step 3: Finally, the Z-score derives by subtracting the mean from the data point, and then the result is divided by the standard deviation, as shown below.

Examples
Let us consider the following examples to understand how to use the formula to calculate the Z score.
Example #1
Let us take the example of a class of 50 students who wrote the science test last week. Today is the result day, and the class teacher told me that John scored 93 on the test while the average class score was 68. So first, determine the Z-score for John’s test mark if the standard deviation is 13.
Solution:
Given,
- John’s test score, x = 93
- Mean, μ= 68
- Standard deviation, ơ = 13
Therefore, one can calculate the Z-score for John’s test score using the above formula,

Z = (93 – 68) / 13
Z Score will be –

Z Score = 1.92
Therefore, John’s Z-test score is 1.92 standard deviation above the average score of the class, which means 97.26% of the class (49 students) scored less than John.
Example#2
Let us take another detailed example of 30 students (as the Z-test is not appropriate for less than 30 data points) who appeared for a class test. Determine the Z-test score for the 4th student of based on the marks scored by the students out of 100: 55, 67, 84, 65, 59, 68, 77, 95, 88, 78, 53, 81, 73, 66, 65, 52, 54, 83, 86, 94, 85, 72, 62, 64, 74, 82, 58, 57, 51, 91.
Solution:
Given,
- x = 65,
- 4th student scored = 65,
- The number of data points, N = 30.
Mean = (55 + 67 + 84 + 65 + 59 + 68 + 77 + 95 + 88 + 78 + 53 + 81 + 73 + 66 + 65 + 52 + 54 + 83 + 86 + 94 + 85 + 72 + 62 + 64 + 74 + 82 + 58 + 57 + 51 + 91) / 30
Mean = 71.30
Now, one can calculate the standard deviation by using the formula as shown below,

ơ = 13.44
Therefore, one can calculate the Z-score of the 4th student using the above formula,
Z = (x – x ) / s
- Z = (65 –30) / 13.44
- Z = -0.47
Therefore, the 4th student’s score is 0.47 standard deviation below the average score of the class, which means that 31.92% of the class (10 students) scored less than the 4th student as per the Z- score table.
Z Score Formula in Excel
Let us take the case mentioned in example 2 to illustrate the concept of Z-score in the Excel template below.
Below is given data for the calculation of the Z-score.
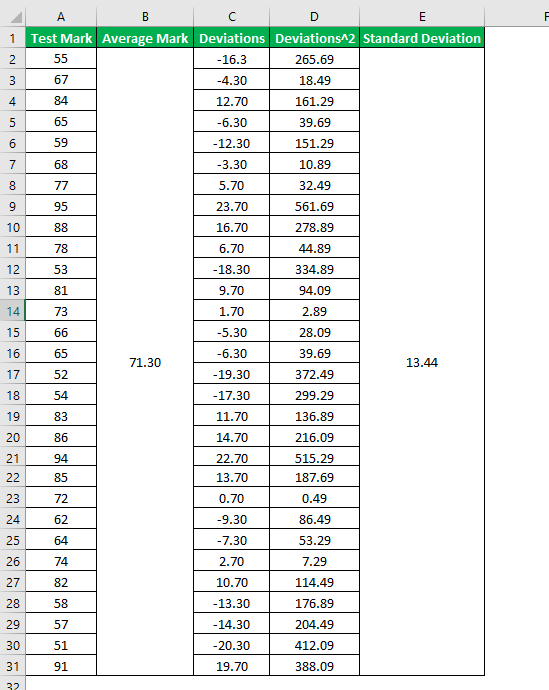

You can refer to the given excel sheet below for the detailed calculation of the Z Score Formula Test Statistics.
How To Use?
Here is a list of ways in which the Z-score formula results can be used:
- From the hypothesis testing perspective, the Z-score is very important to understand because it is employed to test whether or not a test statistic falls in the acceptable range.
- The Z-score is also used to standardize data before analysis and calculate the probability of a score or comparison of two or more data points from different normal distributions.
Frequently Asked Questions (FAQs)
Can the Z-score be negative?
Z-scores can be positive or negative. A positive value shows that the score is above the mean, and a negative score indicates it is below the mean.
How to find the percentile from the Z-score?
One may find the area (in percentage terms) at the left of that Z-score. Then, concerning probability p, the Z-score z is connected to 100.
What is a good Z-score?
A company’s good Z-score is anything above 3. Moreover, it shows that the company is performing well and will not go bankrupt soon.
Which Z-score is better?
The positive Z-scores come from values that are above the mean. Meanwhile, negative Z-scores are obtained from values below the mean. The greater a Z-score’s absolute value, the more extraordinary the data point’s deviation from the mean.
Recommended Articles
This article has been a guide to the Z-Score Formula. Here, we provide the formula to calculate Z-score, practical examples, and a downloadable Excel template. You can learn more about financial analysis from the following articles: –