What is Power View for Excel?
Excel Power View is a data visualization technology that helps create interactive visuals like graphs, charts, etc. It allows analyzing data by looking at the visuals created. Power View can give the Excel data a new life and make it more meaningful. It may help to get insight from data to decide based on the data.
How to Enable Power View for Excel?
If you want to use Power View, you need to enable an “Add-ins” named “Power View” in Excel. After the Add-in is allowed, it will show under the “Insert” tab in the “Menu” bar.
Follow the below steps:
- Step 1: First, we must click on File ->Option.

- Step 2: As a result, the “Excel Options” screen will pop up. Select “Add-ins,” and we may see the “Manage” drop-down at the bottom of the pop-up. Choose “Excel Add-ins. “See highlighted below:

- Step 3: Next, we must select “COM Add-ins” from the drop-down, then click on the “GO” button.

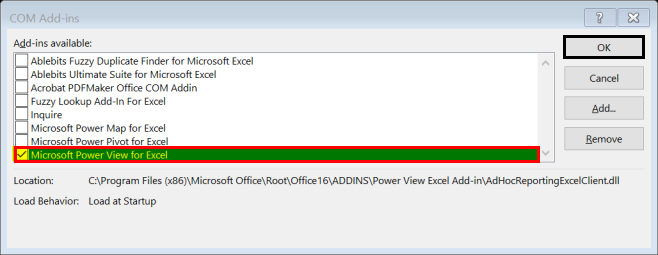
- Step 4: As a result, the “COM Add-ins” screen will pop up. We must check on “Microsoft Power View for Excel” and click “OK.”
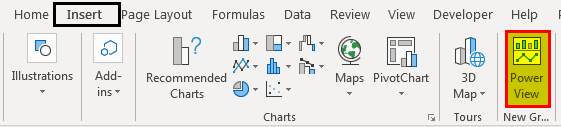
- Step 5: This will add “Power View” under the “Insert” tab.
Remember that “Power View” is available only in Excel 2013 and higher versions. In Excel 2016, we may find “Power View” missing even after enabling add-in. Therefore, we may need to follow the below steps to enable the “Power View.”
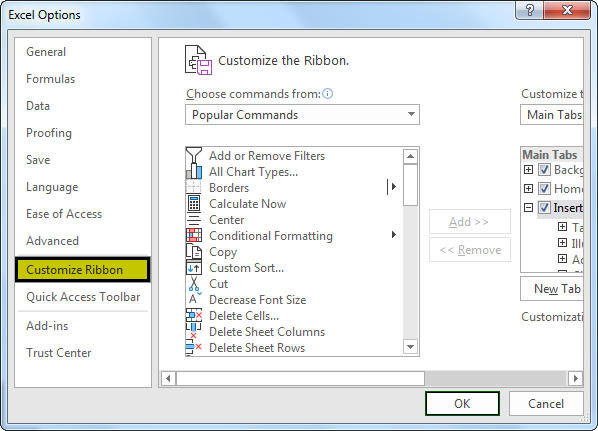
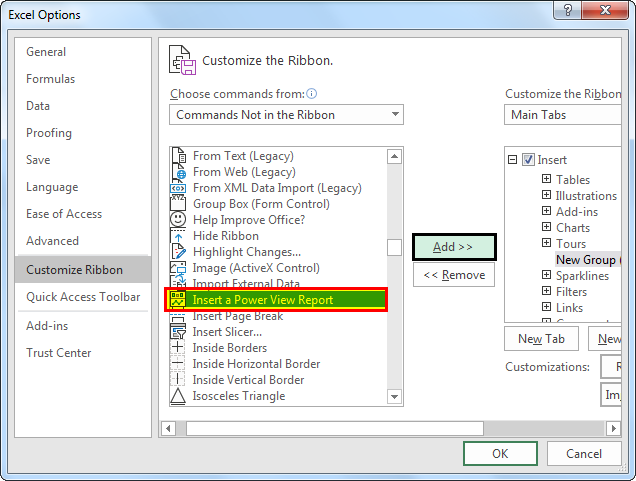
- Step 1: We need to first click on File -> Option.
- Step 2: As a result, the “Excel Options” screen will pop up, and select Customize Ribbon in Excel.
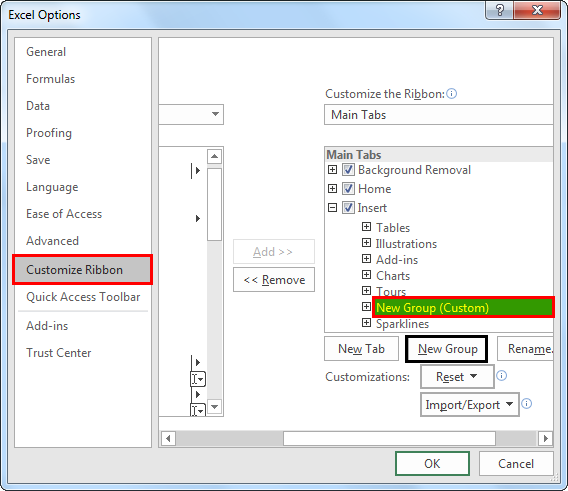
- Step 3: Under “Customize Ribbon,” in the “Main Tabs,” Extend the “Insert” option, then click on “New Group (Custom).”
- Step 4: Now, we must go to “Choose command from” shown on the left and select “All Commands” from the drop-down. Now select “insert a Power View Report.” Then click on “Add,” and this will add “Power View” under your “Insert” tab. (When we click on “Add,” make sure “New group (Custom)” is selected. Else, an error may pop up). Select “OK.”
Now we can see the “Power View” option under the “Insert Tab” in the “New Group” section:
How to Use Power View in Excel? (with an Example)
Once “Power View” is enabled, we are all set to use it. Follow the below steps to create visuals using the “Power View.”
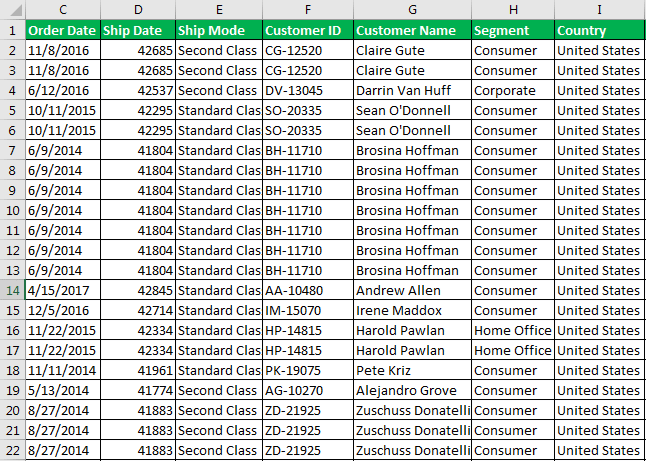
We have some sales data for a superstore, and if someone asks to create an interactive dashboard.
Now, we need to organize data in the form of a table.
To create a table, we must follow the below steps:
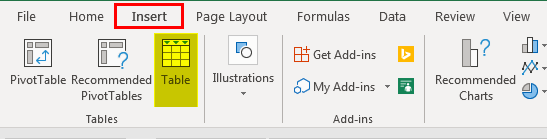
- Step 1: We need to click first anywhere within the data. Then, we must go to “Menu Bar” – “Insert” – “Table.”
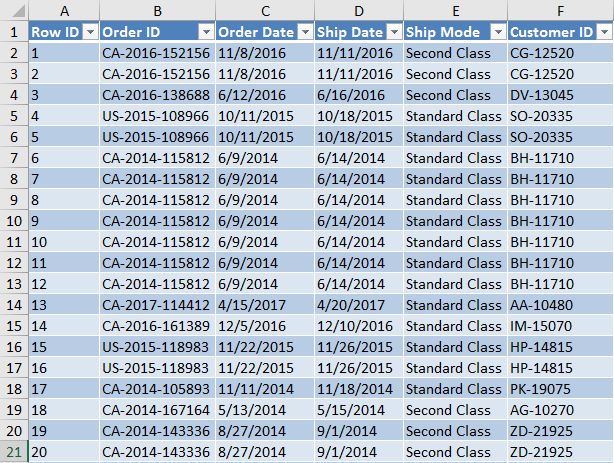
- Step 2: On clicking on “Table,” it will automatically select the data range. However, if we need to change the data range, we can put the range under “Where is the data for your table?.” Then, we must check “My table has headers” if the data has headers. Note: We can use the Ctrl + T shortcut to create the table.

As a result, it will look like the one below.
Now, our data is ready for creating the Power View in Excel.
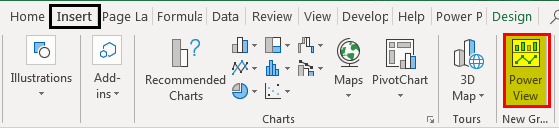
- Step 1: We should first click “Insert.” Under the “Insert” tab, we must select “Power View.”
- Step 2: This will open a new sheet within the workbook (This may take some time to create a Power View sheet. Please wait). Once the window is opened, we may see a table on the left side, filters in the middle, and Power View fields on the right side.
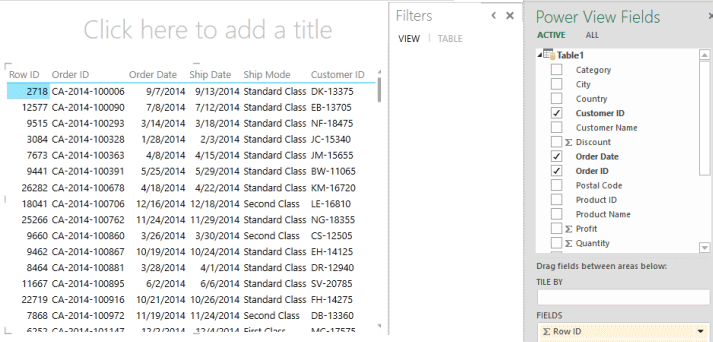
We can give any name to the Power View dashboard. We can review the field and select or deselect the field according to the requirement.
We can see a sign “∑” is used before some fields, which means this field contains a value that should be used to do the calculation.
How to Create a Power View Dashboard?
Now Let’s start creating a dashboard:
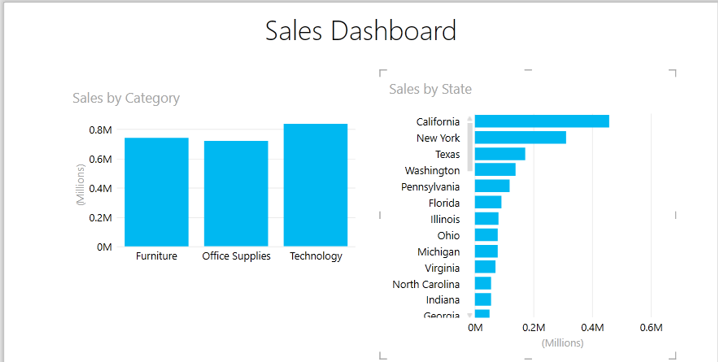
- Step 1: First, we must select the “Category” and “Sales” values from the Power View fields.
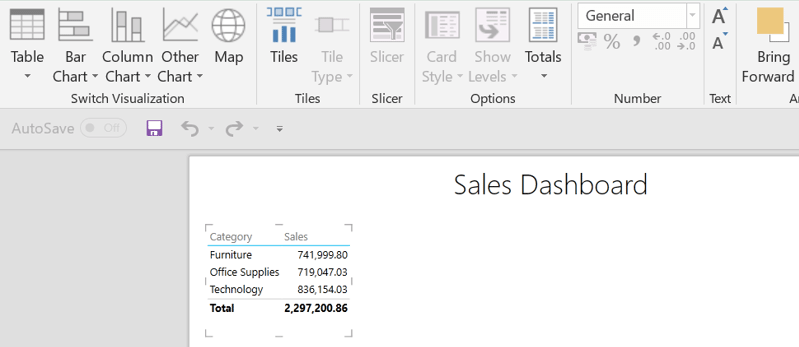
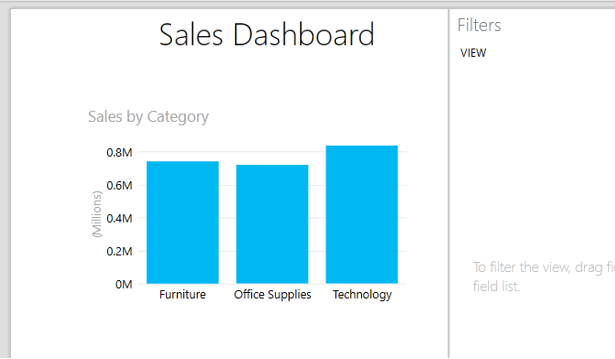
- Step 2: Then, click on “Insert” – Column chart. It will look like the one shown below.
- Step 3: After that, click on the dashboard again, select “State” and “Sales” amount, and select Bar chart. The “sort by” option will show when we hover over the chart. So, we can sort it accordingly.
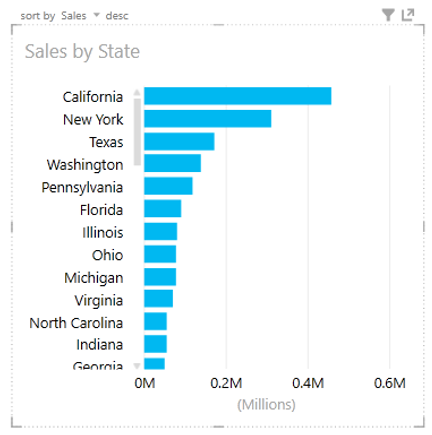
Now, the chart will look like the one below.
Let us see sales based on segments.
- Step 4: We must initially select “Segment” and “Sales” from the field list and choose the Pie chart under the “Other chart” option. The final chart will look like the one below.
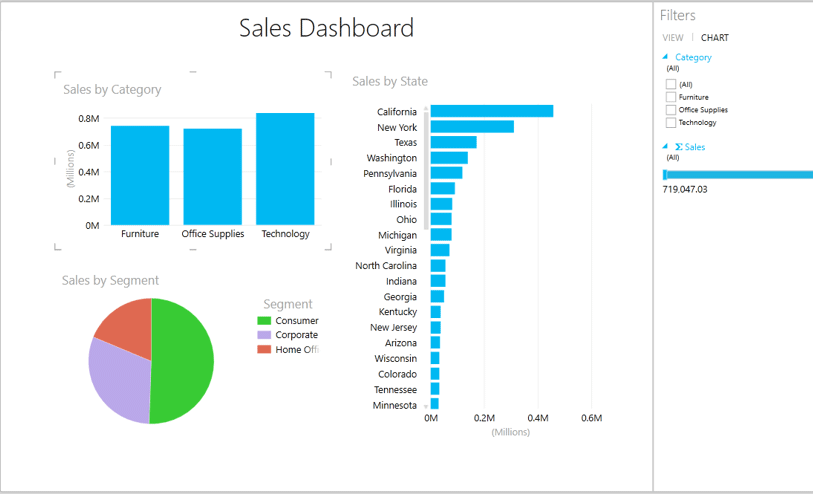
Let us see what insight can be found from this dashboard.
- We received the highest sales from the category “Technology.”
- The top 3 states where they made sales are California, New York, and Texas. Similarly, based on the data, we can tell the top 5 or top 10 or whatever is required.
- The “Consumer” segment contributes the most, with more than half of sales. The “Corporate” segment stands second and the “Home Office” segment third.
We can create more dashboards using different charts and maps under the “Design” tab when selecting data in the dashboard.
Things to Remember
- We should arrange data properly in rows or columns, and no column should be left blank between the data.
- We need to install “Microsoft Silverlight” before using Power View if not been installed previously.
- After installing Power View “Add-in” and “Silverlight,” we must restart the application.” Otherwise, this will run an error.
Recommended Articles
This article has been a guide to Power View in Excel. Here, we discuss how to enable power view in Excel and create a dashboard for the same with the help of an example. You can learn more about Excel from the following articles: –