
Table Of Contents
What Is Excel Running Total?
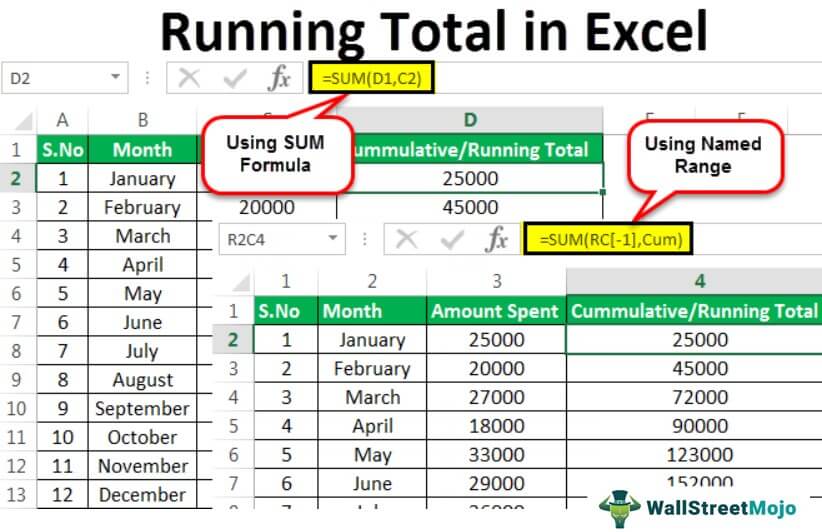
A Running Total in Excel, also called the “Cumulative Sum”, is the summation of numbers increasing or growing in quantity, degree, or force by successive additions. It is the total that gets updated when there is a new entry in the data. In Excel, the usual way to calculate the total is by using the SUM function. So, to calculate the running total to see the data changes with every new entry, the first-row reference must be absolute.
For example, in cell D2, enter the formula =SUM(D1,C1), press "Enter", and drag the formula to the rest of the cells, i.e., D2:D13. We get the output shown below.
Key Takeaways
- The Running Total in Excel, or Cumulative, helps users to find the current total sum, by adding the numeric value with the previous total in the dataset. This will result in the current total sum instead of just the sum of all values.
- It helps us analyze the data’s information for decision-making purposes and retrieve the required month’s performance data or status data.
- Cumulative in Excel is mostly used in financial modeling, and the final cumulative value will be the same as the “Total Sum”.
How To Calculate Running Total (Cumulative Sum) In Excel?
We can calculate the Running Total in Excel using the following methods, namely,
- Using the Simple Formula.
- Using the “SUM” Formula.
- Using a Pivot Table.
- Using a Relative Named Range.
We will consider these methods in detail with specific examples.
Examples
We will consider examples to calculate the Running Total in Excel.
Example #1 – Performing “Running Total or Cumulative” with Simple Formula
The steps to calculate the Running Total using a Simple or Direct formula are as follows:
First, assume that we have the data on our expenses every month as follows:

Select cell C14, enter the formula =SUM(C2:C13), and press “Enter”.
From this data, we can observe that we spent 3,25,000 in total from January to December.

Now, let us see how much of my total expenses were made by the month end.
We will use a simple formula to calculate, select cell D2, and enter the formula =C2.

First, we should consider the amount spent in a particular month, January, as we contemplate our spent calculation from January.

Now, calculate the money spent for the rest of the months as follows:
Select cell D3, and enter the formula =D2+C3. (February)

Press “Enter”. The running total for February month is 45,000.

For the next month onwards, we have to consider the money spent till the previous month and the money spent in the current month. Therefore, for the month of March, select cell D3, and the formula will be =C4+D3.Similarly, drag the formula from cell D3 to D13 using the fill handle for the rest of the months. The result is shown below.

From the above result, we can observe that by the end of the year in December, we had spent 3,25,000, which is the total amount from the start of the year. Therefore, this running total will tell us how much we spent on a particular month.Until July, we had spent 1,88,000. Till November we had spent 2,94,000.

We can also use this data (running total) for certain analyses, as follows:
Q1. If we want to know by which month we had spent 90,000.
Ans. April – We can see the "Cumulative/Running Total" column from the table. It shows that the cumulative spending till April month is 90,000.

Q2. Suppose we want to know the % of money spent that we had spent till July.
Ans. 58% – We can take the amount spent till July and divide it by the total amount spent as follows.
Select cell E8, enter the formula =D8/C14, and make C14 absolute by pressing the F9 key.

Press “Enter”. We have spent 58% of the money until July, as shown below.

Example #2 – Performing “Running Total or Cumulative” with “SUM” Formula
In this example, we will use the SUM in excel instead of the “+” operator to calculate the cumulative in Excel.

But, first, apply the SUM Formula in excel. Select cell D2, and enter the formula =SUM(D1,C2)

While using the SUM function, we should consider summing the earlier month spent and the current month spent. But for the first month, we should add earlier cells, i.e., cumulative, which will be regarded as zero.
Press “Enter”. The result in cell D2 is 25000, as shown below.

Then, drag the formula to other cells, i.e., from cell D2 to D13, using the fill handle. The final output is shown below.

Example #3 – Performing “Running Total or Cumulative” with a PivotTable
To perform running total using a PivotTable in Excel, we should first generate a PivotTable. Create a pivot table by selecting the table, and clicking on the PivotTable option from the “Insert” tab.

Once the PivotTable is generated the “PivotTable Fields” pane appears on the right. Now, drag the “Month” column into the “Rows” field, and the “Amount Spent” column into the “Values” field. The table would be as follows:

Again, drag the “Amount Spent” column into the “Values” field to create a total running value. Then, right-click on the column as follows:
Click “Show Value As” option, and you will get an option of “Running Total In”.

Now, we can see the table with a column having cumulative values as follows:

We can change the table’s name by editing the cell with a “Sum of Amount Spent2”.
Example #4 – Performing “Running Total or Cumulative” with a Relative Named Range
We need to make temporary changes in the Excel options to perform running total with a relative named range.
Change Excel reference style from A1 to R1C1 from Excel options as below:
First, in a workbook, select the “File” tab.

Select the “Options” option, as shown below.

The “Excel Options” window appears. Select the “Formulas” option on the left, and on the right check, the “R1C1 reference style” checkbox, which refers to “Row 1” and “Column 1”, and click “OK”.

Then, this style can find positive and negative signs used for a reason.
In Rows: -
- The +(positive) sign refers to a “Downward” direction.
- The – (negative) sign refers to an “Upward” direction.
Ex- R connects the cell 3 rows below the current cell. R connects the cell 5 rows above the current cell.
In Columns: -
- The +(positive) sign refers to the “Right” direction.
- The – (negative) sign refers to the “Left” direction.
Ex- C refers to connecting the cell, which is 2 columns right to the current cell, and C refers to connecting the cell, which is 4 columns left to the current cell.
To use the reference style to calculate the running total, we must define a name with certain criteria.
In our example, we have to define the name by “RC” because we are calculating the cumulative sum of the cell’s previous row and column with every month’s expense.
The procedure to Define a name in Excel as desired, here “Cum” is,
Go to the “Formulas” tab, and select “Define Name”.

Then, the “New Name” window pops up, and give the name per your wish and the condition you want to perform for the name you defined. Here, we take RC because we will sum the previous row of the cell and column with every month’s expense.

Once the name is defined, then go to the column of “Cumulative/Running Total”, select cell C2, enter the formula =SUM(RC,Cum), and use the defined name in the SUM function as follows:

Press “Enter”. It tells us to perform SUM with the cell “RC[-1}” and “Cum” (Which is already defined), and in the first cell, we get the same expense incurred in January.

Then, drag down the formula to the end of the table. We can see the cumulative results, as shown below.

Important Things To Note
- A relatively named range running total is performed to avoid the problems with inserting and deleting rows from the data. This operation will refer to the cell as per the condition given, even though we insert or delete rows or columns.
- The “Total Sum” and “Running Total” are different. The key difference is the computation we do. The “Total Sum” will perform the sum of each number in the data series. At the same time, the “Running Total” will sum the previous value with the current value from the data.
