Part of our Data Analysis in Excel guide
What Is Group In Excel?
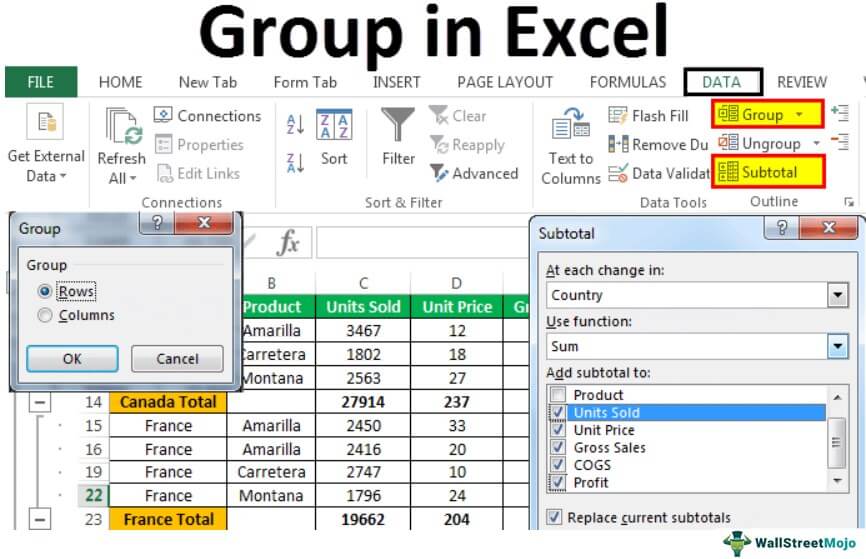
The Group is an Excel tool that groups two or more rows or columns. With this function, the user has the option to minimize and maximize the grouped data. The rows or columns of the group collapse on minimizing and expand on maximizing. The group option is available under the Outline section of the Data tab.
Key Takeaways
- The Group in excel is used to group two or more rows or columns.
- We can collapse or expand the grouped data by minimizing and maximizing, respectively.
- The Excel shortcut keys to group data are Shift+Alt+Right Arrow. Similarly, the shortcut keys to ungroup the grouped data are Shift+Alt+Left Arrow.
- The “clear outline” option removes grouping from the worksheet.
- When we are using the “auto outline” option while grouping, the subtotals can either precede or succeed the grouped data.
- Alternatively, we can also use the shortcut keys Shift+Alt+Left Arrow.
How to Group Data in Excel?
Let us consider a few examples.
Examples
This article must be helpful to understand the Group in Excel, with its formula and examples. You can download the template here to use it instantly.
Example #1 – Auto Outline With Succeeding Subtotals
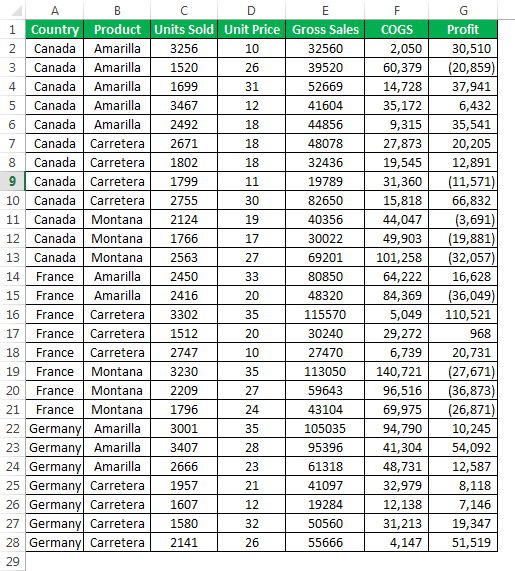
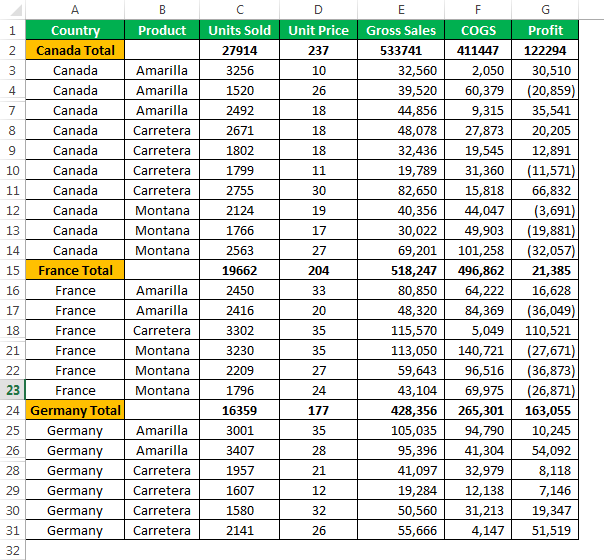
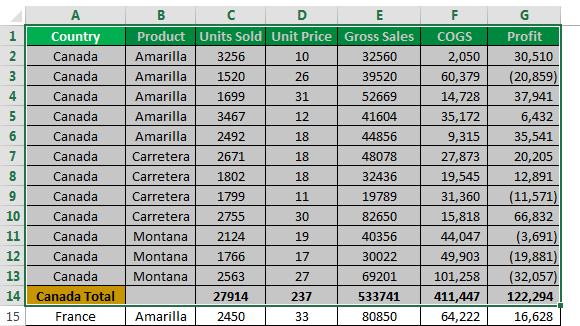
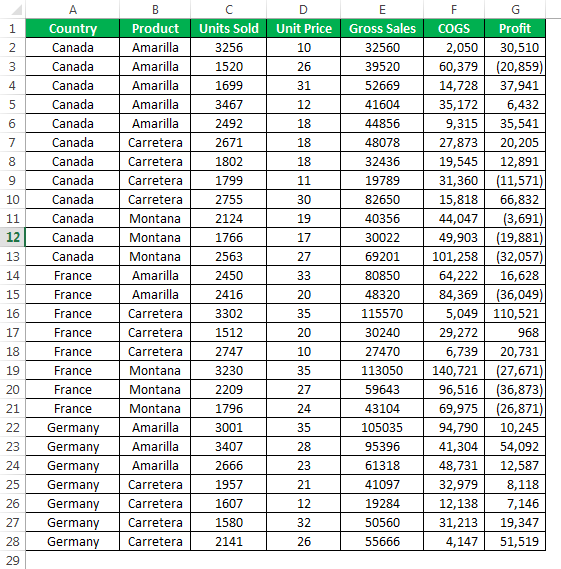
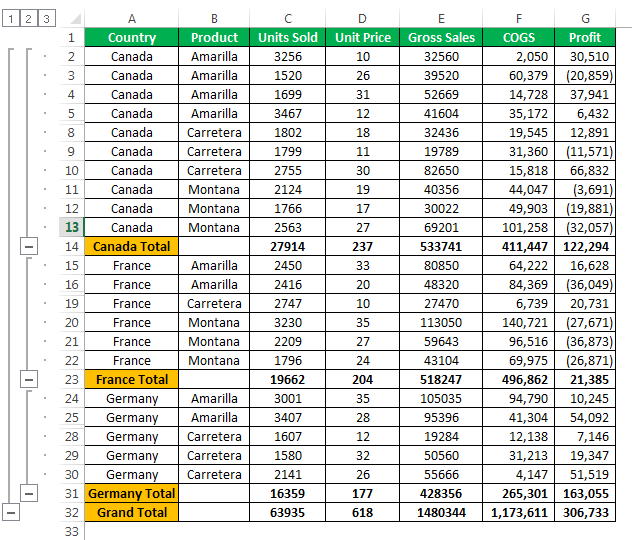
The Excel sheet consisting of the country name, product, units sold, price, gross sales, COGS, and profit is shown in the succeeding image. We can either club the countries into one or group the products into categories to make the data precise.
Let us go with the former approach and club the countries.
The steps to create an auto outline with succeeding subtotals are listed as follows:
Enter the data as shown in the following image.

To each country, add subtotals manually

Place the cursor inside the table. Click on Auto outline in Group under the Data tab.

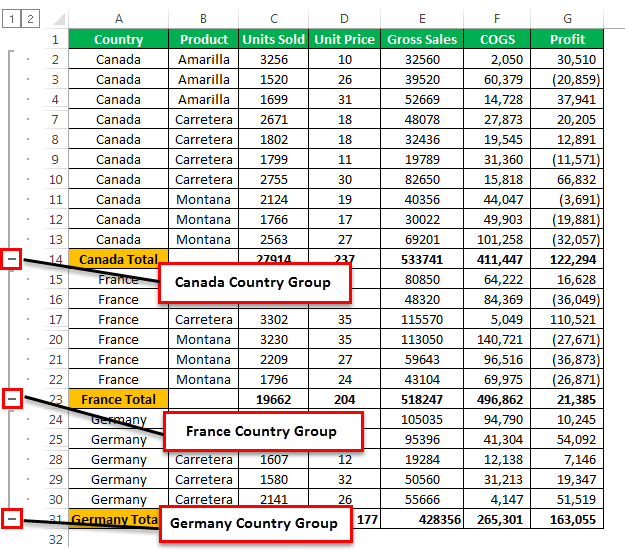
Clicking on Auto Outline will group the range included in the country-wise total.

Clicking the plus sign (+) hides the sub-items of each country. The consolidated summary of every country can be seen as highlighted in the below image.


Example #2 – Auto Outline With Preceding Subtotals
In the previous method, we added the totals at the end of every country. Let us add the totals before the data of a particular country.
The steps to group data with preceding totals are:
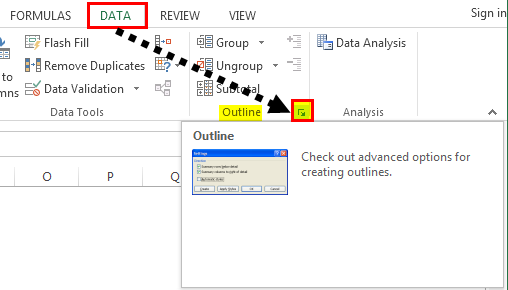
- Step 1: Click on the Dialog Box Launcher under the Outline section of the Data tab.
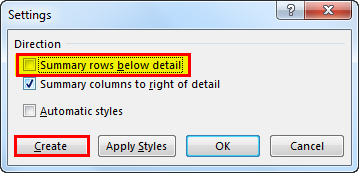
- Step 2: The Settings dialog box appears.
Uncheck the box Summary rows below detail and click on Create to complete the process.
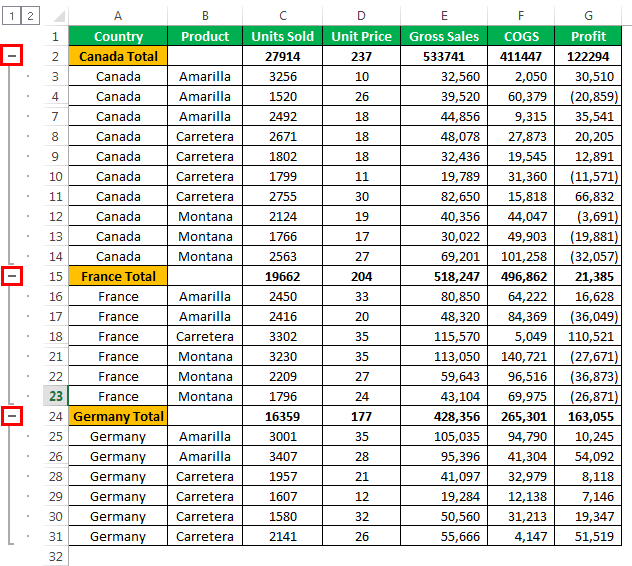
- Step 3: The group buttons appear at the top.
Example #3 – The Collapse And Expansion Of Grouped Data
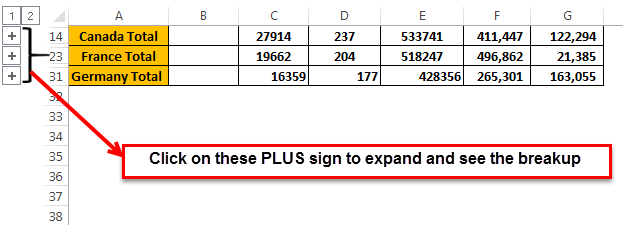
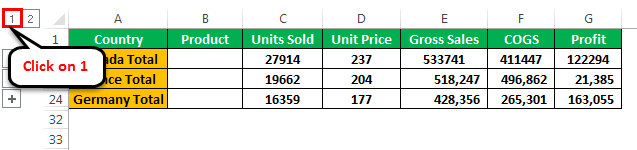
At any point in time, we can collapse or expand the group. In the top left-hand corner, there are two numbers following the name box. The numbers 1 and 2 appear within the boxes.
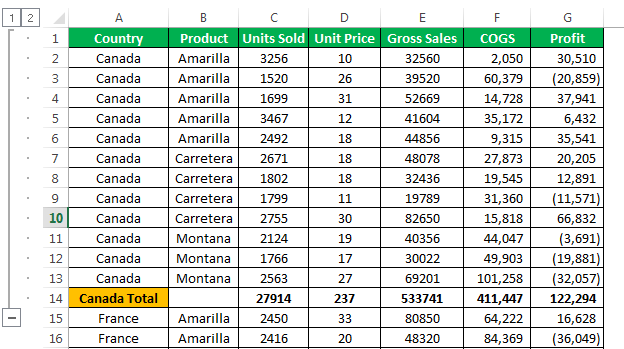
Clicking on 1 reveals the group summary, as shown in the following image.
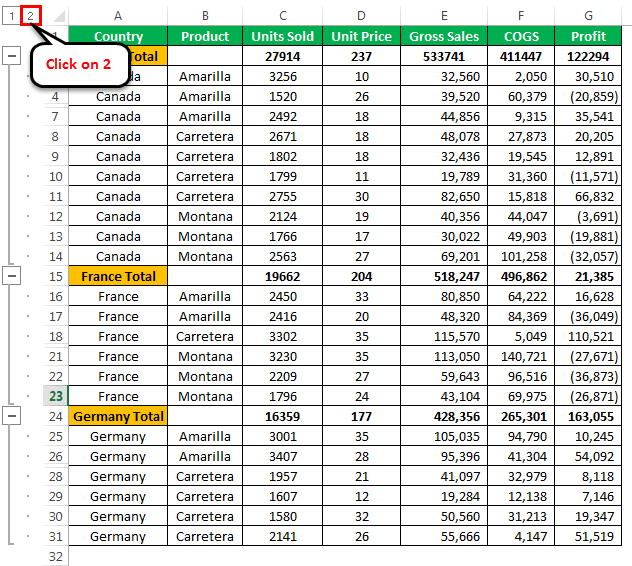
Clicking on 2 expands the table and reveals the breakup of the group, as shown below.
Example #4 – Manual Grouping
The previous examples utilize the basic Excel formulas and groups automatically. An alternative method is to group manually.
The steps for manual grouping are as follows:
- Step 1: Select the range (row-wise) that we have to group. To group Canada, select the range till row 14.
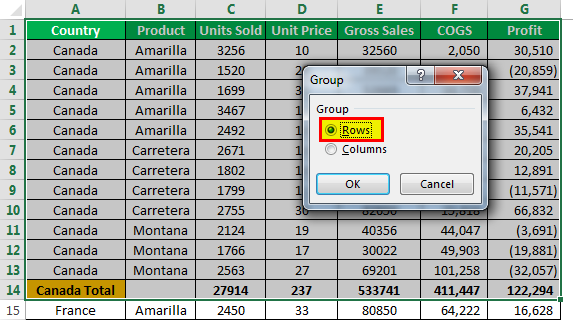
- Step 2: Select Group under the Data tab.
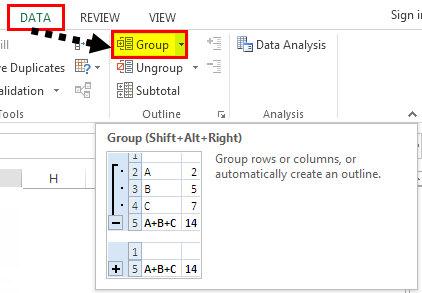
- Step 3: A dialog box, titled Group appears.
Since we are grouping the data row-wise, select “rows” option.
Alternatively, the Excel shortcut Shift+Alt+Right Arrow groups selected cells of the data.
- Step 4: Now, we have grouped the rows of Canada.
Remember, we have to repeat the process of manually grouping for the other countries as well. Please note that we should select the data of every country before grouping.
Note: The data should not contain any hidden rows during manual grouping.
Example #5 – Automatic Subtotals
In the previous examples, we added the subtotals manually. Alternatively, we can also add subtotals automatically.
The steps to add subtotals automatically are:
- Step 1: First, we should remove all the added subtotals manually.
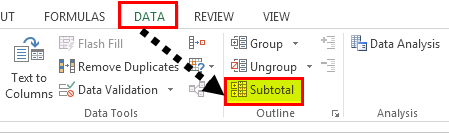
- Step 2: Click on Subtotal under the Data tab.
- Step 3: The Subtotal dialog box appears.
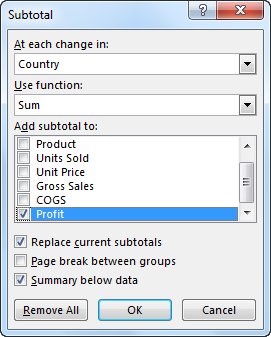
- Step 4: Select the basis on which subtotals are to be added.
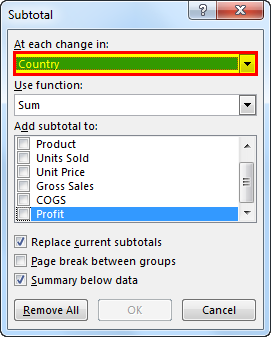
- Select Country as the base, under At each change in: option.
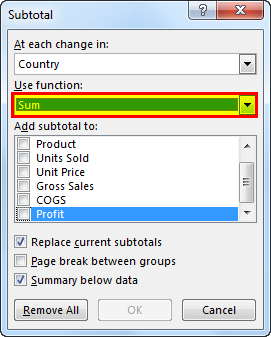
- Step 5: Since totals are required, select Sum under Use function: option.
Note: The user can select different functions like sum, average, min, max, etc., in the “subtotal” dialog box.
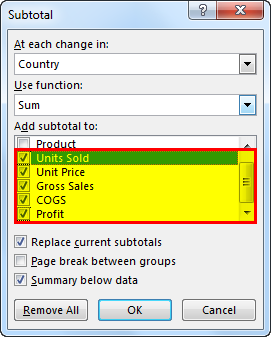
- Step 6: For totaling the columns, select them under Add subtotal to:. Check the boxes for Units Sold, unit price, Gross Sales, COGS, and Profit.
Click OK.
- Step 7: The subtotals and the groups appear, as shown below.
Important Things To Note
- Group in excel is used to group rows and columns.
- It is used to create structured financial models.
- Also, it helps to read complex data.
Frequently Asked Questions (FAQs)
What is group in Excel?
The Group in Excel is a tool that helps club similar data. It provides an organized, compact, and readable view to the reader. For grouping, the worksheet must contain headings and subtotals for every column and row respectively. Moreover, there should not be any blank cells in the data to be grouped.
The groups in Excel are used to create structured financial models. Since groups provide minimize and maximize options, they are used to hide unnecessary calculations.
Why is data grouped and ungrouped in Excel?
The data is grouped and ungrouped for the following reasons:
- Grouping helps read through the detailed and complex data. Ungrouping removes the grouping of rows and columns, thereby helping the user go back to the initial data view.
- With grouping, it is possible to look at the required data sections of the worksheet. Ungrouping helps to look at the entire worksheet data in one go.
Note: The grouping shortcut is Shift+Alt+Right Arrow, and the ungrouping shortcut is Shift+Alt+Left Arrow.
How does ungrouping work in Excel?
The ungrouping of data works as follows:
- To ungroup the entire data, clear the outline.
Click Clear outline under the Ungroup arrow (Outline section of the Data tab). - To ungroup particular data, select the rows to be ungrouped. In the ungroup box, select Rows option and click OK.
Alternatively, we can also use the shortcut keys Shift+Alt+Left Arrow.
Note: Ungrouping does not delete any data. In case the outline is removed, it cannot be undone with Ctrl+Z.
Recommended Articles
Continue with these closely related articles from the same guide.