What Is Net Debt?
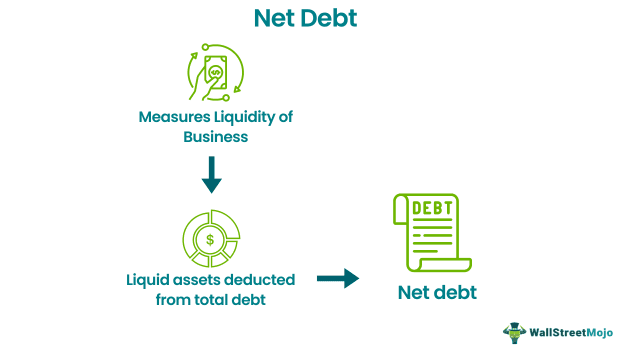
Net Debt is a metric used to measure the company’s financial liquidity and assist in determining if the company can pay off its obligations by comparing the liquid assets with the total debt. In simple words, it is the amount of debt the company has compared to the liquid assets and calculated as Debt minus cash and cash equivalents.
It helps us understand how a company is doing debt-wise. It helps the investors have a closer look at where a company stands in terms of liabilities. The liabilities of a company shouldn’t exceed the company’s cash inflows. Otherwise, it would be impossible for a company to pay off its dues when the time is due.
Key Takeaways
- Net debt is a metric used to assess a company’s financial liquidity and ability to meet its financial obligations.
- A higher level of cash and cash equivalents relative to debt results in a lower net debt value, indicating that the company is in a strong financial position and well-equipped to repay its debt obligations.
- A higher net debt value suggests that the company may be struggling financially and may have difficulty repaying its debts. Therefore, a lower net debt value is generally considered to be a positive sign for a company’s financial health.
Net Debt Explained
The concept of net debt is widely used in the corporate world to assess the financial strength of a business. It is a very useful metric that helps in evaluating whether the business will be able to meet its debt obligations at the earliest, if it became due, clearly indicating its liquidity level.
It total debt obligation is compared to all other liquid assets in the balance sheet of the company to find the value of adjusted net debt. If the company still has enough cash to meetits other obligations after paying off its debt, then its financial condition is strong. The liquid assets that are deducted from the debt in this case, include items like cash and cash equivalent, commercial papers, treasury bills, or any other assets that can be converted into cash very easily.
A very high value net value of debt in the balance sheet indicates that the business is highly leveraged, which has both pros and cons. The loan may provide funds for operation but creates a huge obligation of repayment. However, the low net value of debt should ideally be good for the company, indicating very less pressure of meeting debt obligation.
Net debt calculation is essential for analysts, investors, and other stakeholders of the company to analyze this metric before making investment decisions for both the short and long term. The current debt obligation will indicate the capacity of the business to give a return to investors in the form of dividends. It is also important to note that a financially stable balance sheet will tend to have good price appreciation in the market, leading to gains for shareholders. Therefore, analysis of this metric is very important.
Net Debt Video Explanation

Formula
Here’s the formula net debt calculation–
Net Debt = (Short Term Debt + Long Term Debt) – Cash & cash Equivalents
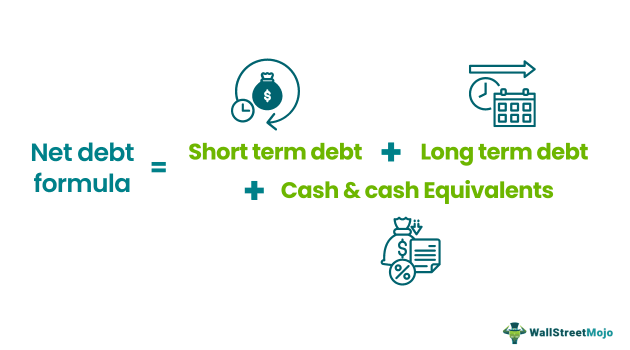
In the net debt formula above, we have three components.
- The first component is the short-term debt. Short-term debts are called current debts. They can be due in less than a year. Current debts may include a short-term loan, a short-term payment of a long-term loan, etc.
- The second component of the formula is long-term debt. The long-term debt is due in the long run. But the companies need to make sure that the long-term debt is paid off when it is due (that may mean making periodic payments or paying at the end of the tenure).
- The third and the last components are cash & cash equivalents. Cash & cash equivalents include cash on hand, a liquid investment with a maturity of three months or less, checking accounts, treasury bills, etc.
The idea of adjusted net debt is to see how much debt would still be left by removing the cash & cash equivalents from the picture (as it is already in ownership of the company). It means that if all the cash & cash equivalents are used to pay off a portion of the company’s total debt, how much debt would still be left for the company to pay off.
Examples
Let us understand the concept of net debt position with the help of some suitable examples.
Example#1
Go Technology has a great reputation in the market. Ramen, a new investor, knows that irrespective of a great reputation, it is important to check the company’s financial health. Here’s the information he found –
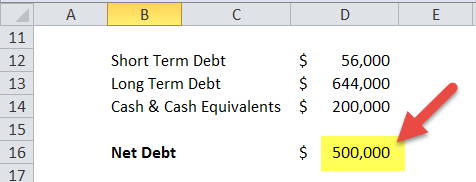
- Short term debt of the company – $56,000
- Long term debt of the company $644,000
- Cash & Cash Equivalents – $200,000
Find out the debt position on behalf of Ramen.
Using the formula of net debt = (Short Term Debt + Long Term Debt) – Cash & Cash Equivalents
- = ($56,000 + $644,000) – $200,000 = $500,000.
To know whether it is lower or higher, we need to look at other companies in the same industry.
Example #2
Below is the balance sheet of Colgate of 2016 and 2017.
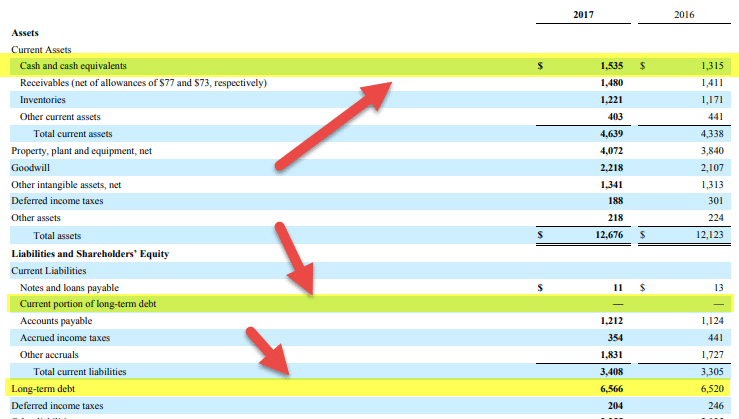
source: Colgate 10K Filings
Net Debt Formula = Short Term Debt + Long Term Debt – Cash and Cash Equivalents.
Colgate’s Debt (2017)
- Short-Term Debt of Colgate = 0
- Long-Term Debt of Colgate = $6,566 million
- Cash and Cash Equivalent = $1,535 million
- Net debt (2017) = 0 + $6,566 – $1,535 = $5,031 million
Colgate’s Debt (2016)
- Short-Term Debt of Colgate = 0
- Long-Term Debt of Colgate = $6,520 million
- Cash and Cash Equivalent = $1,315 million
- Net debt (2017) = 0 + $6,520 – $1,315 = $5,205 million
The above examples clearly explain the financial concept of net debt position and show how to identify the items from the balance sheet of a company to calculate the same in order to assess the current financial condition and make informed investment decisions.
Uses
For every investor, it is important to know whether a company is doing well financially or not. Thus, to check whether a company is in financial distress, they use the net debt formula. This formula helps them understand the true financial stance of a company.
- A larger debt and a larger cash & cash equivalents will lower net value. A lower value is an indication that the company is doing quite well. It means the company is in great shape financially to pay off its debt.
- On the other hand, the higher net value is an indication that the company has not been doing pretty well financially.
- It helps in decision making regarding investing for shareholders, bondholders and lenders. The value indicates how attractive the future prospects of the company is.
- It is useful for management related decisions like dividend payment, buyback of stocks, investment in growth expansion and innovation.
- It is a great means to analyse the creditworthiness of the business. A company with high debt levels less free funds to meet obligations and has to have good revenue and profit levels in order to secure a high credit rating, Therefore, lenders often use this value to assess the solvency of the company.
- During merger of acquisitions, acquirers need to assess the debt levels of the target company to understand the financial impact that the deal will have on the acquirer.
Knowing this will help the investors decide whether they should invest in the company’s stock or not.
Formula In Excel (with excel template)
Let us now do the same example above in Excel.
This is very simple. You need to provide the three inputs of Short Term Debt, Long Term Debt, and Cash & Cash Equivalents.
You can easily calculate net debt analysis in the template provided.
Net Debt Vs Total Debt
The above are two different financial metric that are commonly used by stakeholders and management to evaluate the financial condition of the company. However, there are some differences between them, which are as follows:
- The former is the amount of debt left behind after deducting the liquid assets as per the balance sheet of the company, whereas the latter is the amount which depicts the entire debt obligation that the business owes.
- The net debt analysis measures the indebtedness of the business in a more refined and particular manner. It gives a more realistic view of the financial status, whereas the latter takes the value of debt as per its total amount, including the long and short term.
- The former accounts for the cash, cash equivalents, other liquid instruments like treasury bills, commercial papers, etc, which is not the case for the latter.
- The former depicts the net amount of debt burden which is frequently used by the stakeholders like analysis and investors, whereas the latter shows the overall size of the debt burden.
Even though both have their own pros and cons as a financial metric, both are used widely in the financial market, depending on the type of information required and available about the business.
Frequently Asked Questions (FAQs)
1. Does net debt include accounts payable?
Net debt typically does not include accounts payable, as accounts payable are considered short-term debt and included in a company’s current liabilities. Instead, net debt is calculated by subtracting a company’s total cash and cash equivalents from its total debt.
2. Is net debt a non-GAAP measure?
Net debt is not a standardized GAAP (Generally Accepted Accounting Principles) measure. However, it is commonly used by analysts and investors as a metric for assessing a company’s financial leverage and ability to meet its debt obligations.
3. Should net debt include lease liabilities?
Whether or not lease liabilities should be included in net debt depends on the purpose of the analysis. For example, lease liabilities may be excluded from net debt in some cases because they are considered non-debt liabilities. However, in other cases, lease liabilities may be included in net debt because they represent an obligation to make future payments similar to debt. Ultimately, the decision to include or exclude lease liabilities from net debt should be based on the analysis’s specific context and the information users’ needs.
Recommended Articles:
This has been a guide to what is Net Debt. We explain its formula, differences with total debt, examples, uses, calculator, formula in excel & a video.. We also provide you with a Net Debt Calculator with a downloadable excel template.