What is the Defensive Interval Ratio?
Defensive Interval ratio is the ratio that measures the number of days within which the company can continue its working without the requirement of using its non-current assets or the outside financial resources, and it is calculated by dividing the total current assets of the company with its daily operating expenses.
For example, suppose ABC Company has a DIR of 45 days. That means ABC Company can operate for 45 days without touching the noncurrent assets or long terms assets, or any other financial resources. Many call this ratio a financial efficiency ratio, but it is commonly considered a “liquidity ratio.”
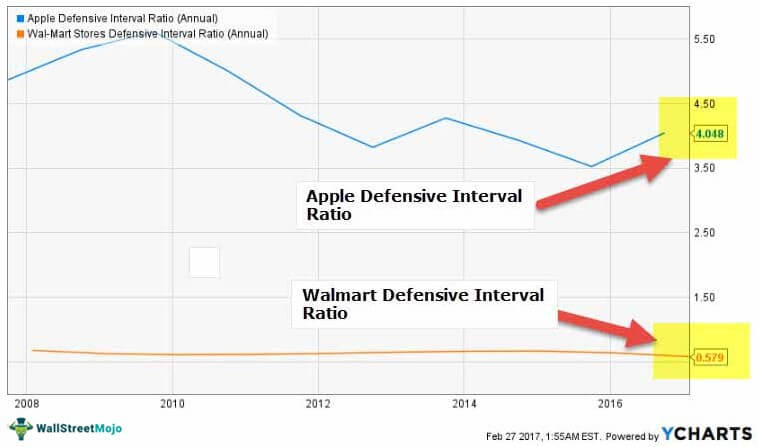
Let us look at the above chart. Apple has a Defensive interval ratio of 4.048 Years, while Walmarts Ratio is 0.579 years. Why is there such a big difference between the two? Does this mean that Apple is better placed from the liquidity point of view?
This ratio is a variation of quick ratio. As an investor, you need to glance at the DIR of a company for a long period. Through DIR, the company and its stakeholders get to know for many days it can use its liquid assets to pay its bills. If it’s gradually increasing, the company can generate more liquid assets to pay for day-to-day activities. And if it’s gradually declining, that means the buffer of the company’s liquid assets is gradually declining too.
To calculate Defensive Interval Ratio (DIR), all we need to do is take out the liquid assets (easily convertible into cash) and then divide it by average expenditure per day. In the denominator, we cannot include every average expense as that may not be used in day-to-day activities. And on the numerator, we can only put items that are easily convertible in cash in the short term.
In simple terms, go to the balance sheet. Look at the current assets. Select the items that can easily convert into cash. Add them up. And then divide it by the average daily expenditure.
- The defensive interval ratio determines the days the company can work without utilizing non-current assets or outside financial resources. It is calculated by dividing the company’s total current assets by the daily operating expenses.
- This ratio is a quick ratio variation.
- One must remove the liquid assets (easily convertible into cash) and divide them by the average daily expenditure for the calculation. In the denominator, every average expense is excluded as that may not be utilized in everyday activities. Only items readily convertible in cash in the short term are recorded in the numerator.
Defensive Interval Ratio Formula
Here’s the formula –
Defensive Interval Ratio (DIR) = Current Assets / Average Daily Expenditures
Now the question is what we would include in the current assets.
We need to take only those easily converted into cash or equivalent items. There are three things we would generally include in the numerator –
Current Assets (that can be converted into liquidity easily) = Cash + Marketable Securities + Trade Accounts Receivable
Other Liquidity Ratios Related articles – Current Ratio, Cash Ratio, and Quick Ratio
We have included these three because they can be easily converted into cash.
Also, check out these articles on Current Assets – Cash & Cash Equivalents, Marketable Securities, Accounts Receivable.
Now let’s look at the denominator.
The easy way to find average daily expenditures is to note the costs of goods sold and annual operating expenses. Then we need to deduct any non-cash charges like depreciation, amortization, etc. Then finally, we will divide the figure by 365 days to get the average daily expenditures.
Average Daily Expenditures = (Cost of Goods Sold + Annual Operating Expenses – Noncash Charges) / 365
The defensive Interval Ratio is considered the best liquidity ratio by many financial analysts. Most of the liquidity ratios like the quick ratio current ratio assess the current assets with current liabilities. And thus, they are unable to produce an accurate result about liquidity. In the case of this ratio, the current assets are not compared to current liabilities; rather, they are compared to expenses. Thus, DIR can produce almost an accurate result of the company’s liquidity position.
But there are a few limitations, which we will discuss at the end of this article. So the idea is to calculate DIR along with the quick and current ratios. It will give the investor a holistic picture of how a company is doing in terms of liquidity. For example, if Company MNC has huge expenses and almost no liabilities whatsoever, the DIR value would be drastically different from the quick ratio or current ratio.
Video Explanation of Defensive Interval Ratio

Interpretation
While interpreting the result you get out of the DIR calculation, here’s what you should consider going forward –
- Even if Defensive Interval Ratio (DIR) is the most accurate liquidity ratio you would ever find, there is one thing that DIR is not noting. If, as an investor, you are looking at DIR to judge the company’s liquidity, it would be important to know that DIR doesn’t consider the financial difficulty the company faces over the period. Thus, even if the liquid assets are enough to pay off the expenses, it doesn’t mean the company is always in a good position. As an investor, you need to look deeper to know more.
- While computing the average daily expenses, you should also consider the cost of goods sold as part of the expenses. Many investors don’t include it as part of the average daily expense, which ushers in a different resultant figure than the accurate one.
- If the DIR is more in terms of days, it is considered healthy for the company, and if the DIR is less, it needs to improve its liquidity.
- The best way to find out liquidity about a company may not be a Defensive Interval Ratio. Because in any company, every day the expenditure is not similar. It may so happen that there are no expenses in the company for a few days, and suddenly one day, the company can incur a huge expense, and then for a while, there would be no expense again. So to find out the average, we need to even out the expenses for all the days, even if there are no expenses incurred. The ideal thing to do is to note every expense per day and find out a trend function where these expenses are repeatedly incurred. It will help to understand the liquidity scenario of a company.
Defensive Interval Ratio Example
We will look at a few examples to understand DIR from all angles. Let’s get started with the first example.
Example # 1
Mr. A has been investing in businesses for a while. He wants to understand how Company P is doing in terms of liquidity. So he looks at Company P’s financial statements and discovers the following information –
Particulars of P Company at the end of 2016
| Details | 2016 (In US $) |
|---|---|
| Cash | 30,00,000 |
| Trade Receivables | 900,000 |
| Marketable Securities | 21,00,000 |
| Average Daily Expenditure | 200,000 |
How would he find almost an accurate picture of Company P’s liquidity?
It is a simple example. Here we need to calculate Defensive Interval Ratio (DIR) by applying the formula straight since all the information is already given.
The formula of DIR is –
Defensive Interval Ratio (DIR) = Current Assets / Average Daily Expenditures
Current Assets include –
Current Assets (that can be converted into liquidity easily) = Cash + Marketable Securities + Trade Accounts Receivable
Let’s calculate the DIR now –
| Details | 2016 (In US $) |
|---|---|
| Cash (1) | 30,00,000 |
| Trade Receivables (2) | 900,000 |
| Marketable Securities (3) | 21,00,000 |
| Current Assets (4 = 1+2+3) | 60,00,000 |
| Average Daily Expenditure (5) | 200,000 |
| Ratio (4/5) | 30 days |
After the calculation, Mr. A finds that the liquidity position of Company P is not good enough, and he decides to look into other aspects of the company.
Example # 2
Mr. B isn’t able to find the Balance Sheet of Company M., But he has the following information available with him –
| Details | 2016 (In US $) |
|---|---|
| Cost of Goods Sold (COGS) | 30,00,000 |
| Operating expenses for the year | 900,000 |
| Depreciation Charges | 100,000 |
| Defensive Interval Ratio | 25 days |
Mr. B needs to find the current assets of Company M, which are easily convertible into cash.
We have been given the information for computing the average daily expenditure, and we know how to calculate the defensive interval ratio. By applying the information given above, we can find out the current assets of Company M, which are easily convertible.
We will start by computing the average daily expenditure.
Here’s the formula –
Average Daily Expenditures = (Cost of Goods Sold + Annual Operating Expenses – Non-cash Charges) / 365
So, let’s calculate using the given information –
| Details | 2016 (In US $) |
|---|---|
| Cost of Goods Sold (COGS) (1) | 30,00,000 |
| Operating expenses for the year (2) | 900,000 |
| Depreciation Charges (3) | 100,000 |
| Total expenses (4 = 1 + 2 – 3) | 38,00,000 |
| Number of days in a year (5) | 365 days |
| Average Daily Expenditure (4/5) | 10,411 |
Now we will use the formula of DIR to find out the current assets, which can easily convert into cash.
| Details | 2016 (In US $) |
|---|---|
| Average Daily Expenditure (A) | 10,411 |
| Defensive Interval Ratio (B) | 25 days |
| Current Assets (C = A * B) | 260,275 |
Now Mr. B has got to know how much current assets of Company M can be converted into cash in the short term.
Example # 3
Mr. C wants to compare the three companies’ liquidity positions. He has furnished below the following information to his financial analyst to come to the right conclusion. Let’s have a look at the details below –
| Details | Co. M (US $) | Co. N (US $) | Co. P (US $) |
|---|---|---|---|
| Cash | 300,000 | 400,000 | 500,000 |
| Trade Receivables | 90,000 | 100,000 | 120,000 |
| Marketable Securities | 210,000 | 220,000 | 240,000 |
| Cost of Goods Sold | 200,000 | 300,000 | 400,000 |
| Operating Expenses | 100,000 | 90,000 | 110,000 |
| Depreciation Charges | 40,000 | 50,000 | 45,000 |
The financial analyst needs to determine which company is better positioned to pay off the bills without touching any long-term assets or external financial resources.
This example is a comparison between which company is in a better position.
Let’s get started.
| Details | Co. M (US $) | Co. N (US $) | Co. P (US $ |
|---|---|---|---|
| Cash (1) | 300,000 | 400,000 | 500,000 |
| Trade Receivables (2) | 90,000 | 100,000 | 120,000 |
| Marketable Securities (3) | 210,000 | 220,000 | 240,000 |
| Current Assets (4 = 1+2+3) | 600,000 | 720,000 | 860,000 |
Now we will calculate the annual daily expenditure.
Now we can calculate the ratio and determine which company has a better liquidity position.
| Details | Co. M (US $) | Co. N (US $) | Co. P (US $ |
|---|---|---|---|
| Current Assets (1) | 600,000 | 720,000 | 860,000 |
| Average Daily Expenditure (2) | 712 | 932 | 1274 |
| Defensive Interval Ratio (1/2) | 843 days* | 773 days | 675 days |
*Note: These are hypothetical situations and are only used to illustrate DIR.
From the above computation, it’s clear that Co. M has the most lucrative liquidity position among all three.
Colgate Example
Let us calculate the Defensive Interval Ratio for Colgate.
Step 1 – Calculate Current Assets that can convert into cash easily.
- Current Assets (that can be converted into cash easily) = Cash + Marketable Securities + Trade Accounts Receivable
- Colgate’s Current Assets contain Cash & Cash Equivalents, Accounts Receivables, Inventories, and Other current assets.
- Only two items out of these four can be readily converted to cash – a) Cash and Cash Equivalents b) Receivables.
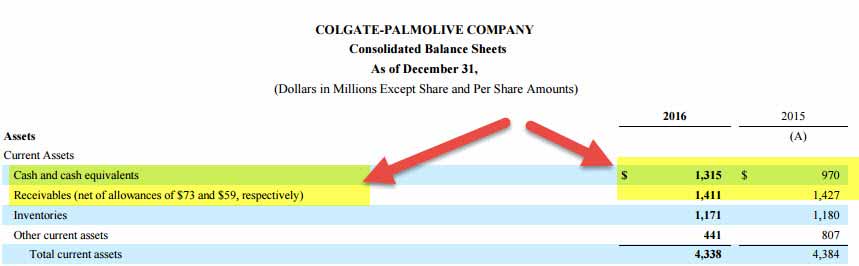
source: Colgate 10K Filings
- Colgate Current Assets (that can be converted to cash easily) = $1,315 + 1,411 = $2,726 million
Step 2 – Find the Average Daily Expenditures
To find the average daily expenditure, we can use the following formula.
Average Daily Expenditures = (Cost of Goods Sold + Annual Operating Expenses – Non Cash Charges) / 365.
It is a bit tricky here as we are not spoon-fed with all the necessary information.
- From the Income Statement, we get the two items a) Cost of Sales b) Selling General and Administrative Expenses.
- Another expense is not operating expense and hence excluded from the expenditure calculations.
- Also, the Venezuela accounting is not an operating expense and is excluded.
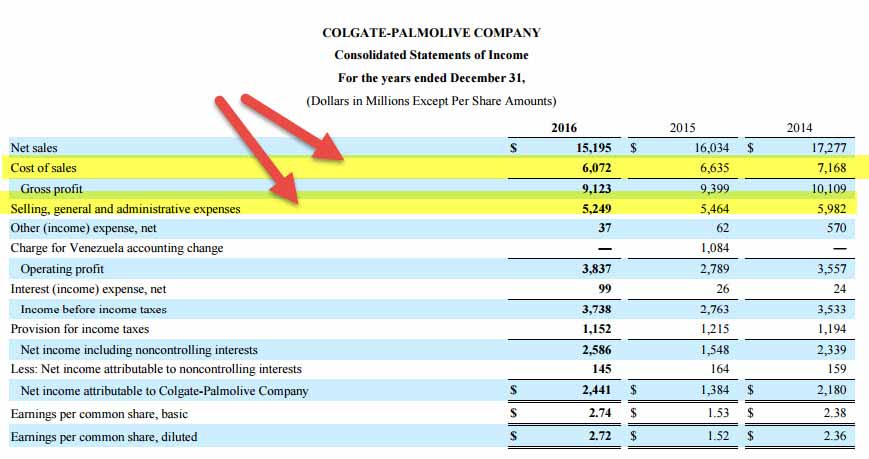
source: Colgate 10K Filings
To find the non-cash, we need to scan the annual report of Colgate.
There are two types of non-cash items included in the Cost of Sales or Selling General & Admin expense.
2a) Depreciation & Amortization
- Depreciation and Amortization is a non-cash expenses. As per Colgate’s filings, Depreciation attributable to manufacturing operations is included in Cost of sales.
- The remaining depreciation component is included in Selling, general and administrative expenses.
- The total Depreciation and Amortization figures are provided in the cash flow statement.
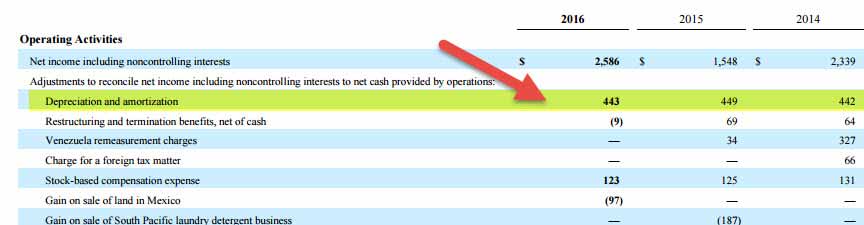
source: Colgate 10K Filings
- Depreciation and Amortization (2016) = $443 million.
2b) Stock-Based Compensation
- Colgate recognizes the cost of employee services received in exchange for awards of equity instruments, such as stock options and restricted stock units, based on the fair value of those awards at the grant date over the requisite service period.
- These are called Stock-Based Compensation. In Colgate, Stock-based compensation expense is recorded within Sel.
Frequently Asked Questions (FAQs)
What is an excellent defensive interval ratio?
There is no specific answer since it may differ from company to company based on the particular industry and situation. Nevertheless, an excellent defensive interval ratio (DIR) may be above 50 days or can be more.
Should the defensive interval ratio be high or low?
A higher DIR is very suitable since it shows the company has more liquid. However, it may help the company as it shows that capital can be utilized more effectively to create enormous profits.
What is the usefulness of the defensive interval ratio?
The defensive interval ratio can be observed over the period to estimate whether a company’s liquidity buffer fulfilling its expenses is increasing or decreasing. As a result, prominent analysts believe the defensive interval ratio (DIR) is more valuable than the quick or current ratio, which compares assets to actual expenses instead liabilities.