Table Of Contents
What is the Cash Ratio?
The cash ratio is the ratio that measures the ability of the company to repay the short-term debts with the cash or cash equivalents, and it is calculated by dividing the total cash and the cash equivalents of the company with its total current liabilities.
- If the ratio is more than 1, would it indicate that there is inefficiency in utilizing the cash to earn more profits or the market is saturating
- If the ratio is less than 1, would it indicate that the firm has utilized the cash efficiently or has not made enough sales to have more cash?
Looking at the graph below, we note that Starbucks has the highest cash ratio (0.468x in FY2016) compared to Colgate and Procter & Gamble. But what does it mean by this ratio? Does it matter if this ratio of a company is more than 1? We will find out in this article.
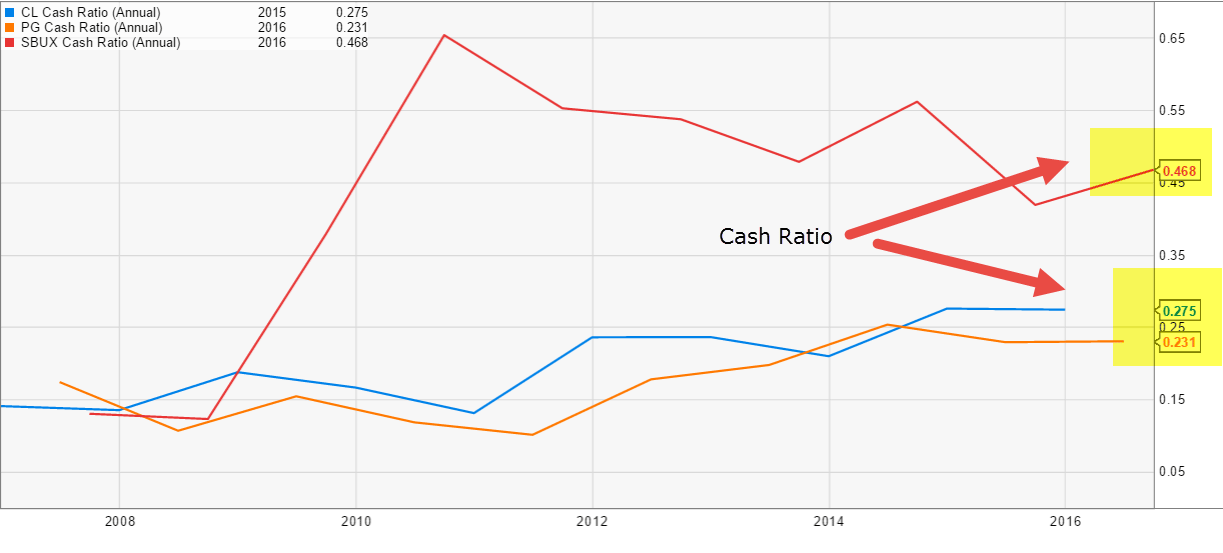
Table of contents
- The cash ratio estimates the company's ability to repay short-term debts with cash or cash equivalents. Moreover, it is evaluated by dividing the company's total cash and cash equivalents by its current liabilities.
- If the cash ratio is less than 1, it shows an inability to use it to obtain more profits, or the market is saturating.
- If the cash ratio exceeds 1, the company has very high cash assets that cannot be used for profit-making business operations.
Cash Ratio Formula
The formula is as simple as it can be. Just divide cash & cash equivalents by current liabilities, and you would have your ratio.
Cash Ratio Formula = Cash + Cash Equivalents / Total Current Liabilities

Most firms show cash & cash equivalents together in the balance sheet. But few firms show the cash and the cash equivalent separately.
But what does the cash equivalent mean?
According to GAAP, cash equivalents are investments and other assets which can convert into cash within 90 days or less. Thus, they get included in the cash coverage ratio.
Current Liabilities are liabilities due in the next 12 months or less.
Let’s look at the cash & cash equivalents and current liabilities that any firm considers to include in their balance sheet.
Cash & Cash Equivalent: Under Cash, the firms include coins & paper money, undeposited receipts, checking accounts, and money orders. And under cash equivalent, the organizations take into account money market mutual funds, treasury securities, preferred stocks which have a maturity of 90 days or less, bank certificates of deposits, and commercial paper.
Current liabilities: Under current liabilities, the firms would include accounts payable, sales taxes payable, income taxes payable, interest payable, bank overdrafts, payroll taxes payable, customer deposits in advance, accrued expenses, short-term loans, current maturities of long-term debt, etc.
Cash Ratio Explained in Video
Interpretation of Cash Ratio
- Let’s say that the Cash & Cash Equivalent > Current Liabilities; that means the organization has more cash (more than 1 in terms of ratio) than they need to pay off the current liabilities. It's not always a good situation as it denotes that the firm has not utilized assets to their fullest extent.
- If Cash & Cash Equivalent = Current Liabilities, that means the firm has enough cash to pay off the current liabilities.
- If Cash & Cash Equivalent < Current Liabilities, then this is the right situation to be in, in terms of the firm’s perspective. Because this means the firm has utilized its assets well to earn profits.
Even if it's a good ratio as it strips away all the uncertainties (receivables, inventories, etc. to turn into cash to pay off current liabilities) from current assets and focuses on only cash & cash equivalent, most of the financial analysts don't use cash ratio to conclude the firm's liquidity position.
Cash Ratio Example
Example 1
Let’s take an example to illustrate this. In the example below, our primary concern would be to see the firm's liquidity position from two perspectives. First, we will look at which company is in a better situation to pay off short-term debt, and second, we will look at which company has better utilized its short-term assets.
| X (in US $) | Y (in US $) | |
|---|---|---|
| Cash | 10000 | 3000 |
| Cash Equivalent | 1000 | 500 |
| Accounts Receivable | 1000 | 5000 |
| Inventories | 500 | 6000 |
| Accounts Payable | 4000 | 3000 |
| Current Taxes Payable | 5000 | 6000 |
| Current Long-term Liabilities | 11000 | 9000 |
| cash coverage ratio | 0.55 | 0.19 |
| Current Ratio | 0.63 | 0.81 |
From the above example, we will be able to make some conclusions.
First, which company is better able to pay off short-term debt for sure (not having any uncertainty)? It’s surely Company X because Company X's cash & cash equivalent is much more than Company Y compared to their respective current liabilities. And if we look at the ratio of both the companies, we would see that the ratio of Company X is 0.55, whereas the cash coverage ratio of Company Y is just 0.19.
Suppose we include the current ratio to the perspective (current ratio = current assets / current liabilities). In that case, Company Y is better positioned to pay off short-term debt (if we consider that account receivables and inventories could be turned into cash within a short period) as its current ratio is 0.81.
From one perspective, it is a good position to be in as nothing is locked up, and the major part has been liquidated. But at the same time, more the cash ratio and less current ratio means (compared to Company Y); Company X could have better utilized the cash lying for asset generation. Even if Company X has more cash, they have lesser accounts receivables & inventories. From this perspective, Company Y has better utilized its cash.
Example 2 - Nestle
In this section, we will take an example from the industry to understand how this ratio works.
Here we will take the raw data into account and calculate this ratio for two consecutive years.
First, we will take into account the balance sheet data of Nestle.
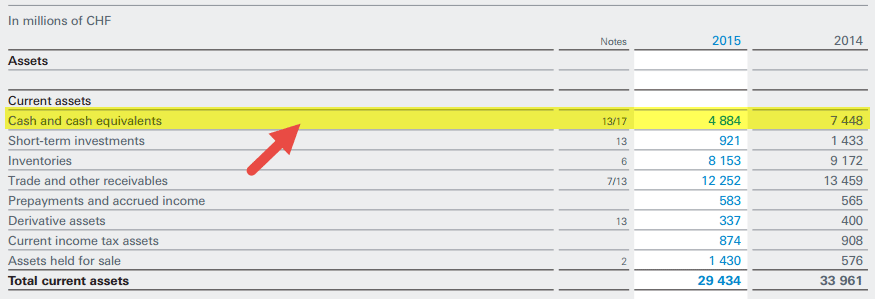

source: Nestle Annual Report
If you look at the balance sheet, you would see that there are two sets of information that are important to us in determining the cash ratio.
The first is the two-year cash & cash equivalent (see the highlighted yellow in the balance sheet above), and the second data, which is useful to us, is the total current liabilities for the years 2014 and 2015.
Now, we would determine this ratio using the simple formula we mentioned above.
In 2014, Nestlé’s ratio was = (7448/32895) = 0.23.
In 2015, Nestlé’s was = (4884/33321) = 0.15.
If we compare the cash coverage ratio of these two years, we would see that in 2015, the ratio is lesser compared to 2014. The reason may be better utilization of cash in the generation of profits.
On the other hand, in 2014, Nestle had more cash to pay off short-term debt than it had in 2015.
Let us now compare Nestle’s cash coverage ratio to its competitors – Hershey's and Danone.
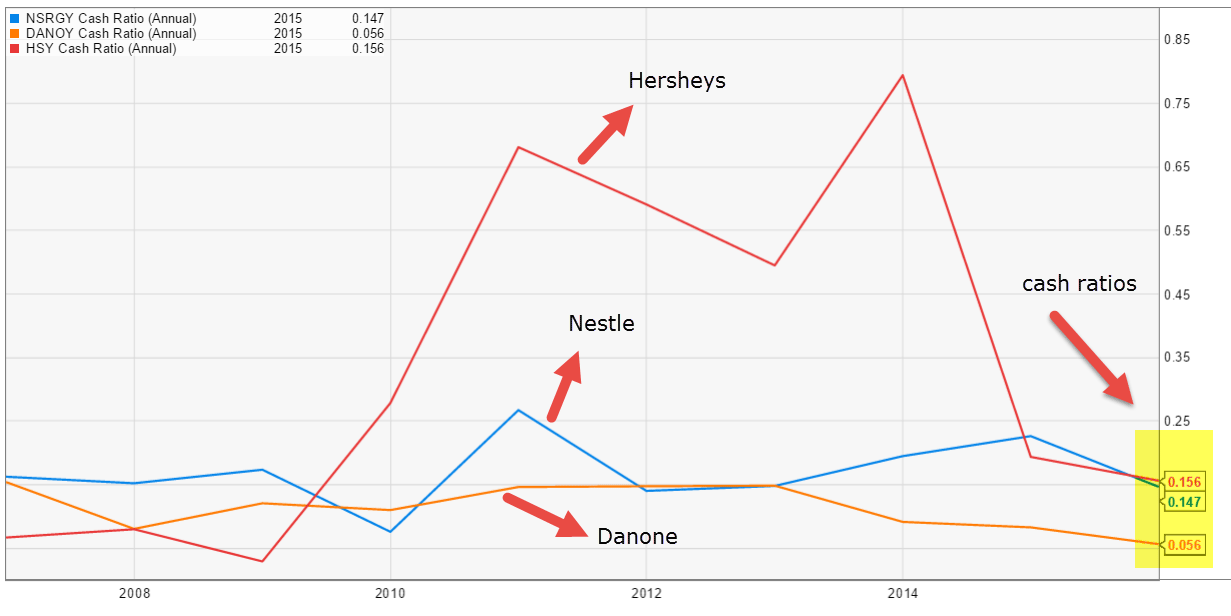
source: ycharts
- We note that Nestle’s ratio has been fairly stable, ranging between 0.14x – 0.25x over the past ten years.
- Danone’s ratio is the lowest among its competitors at 0.056x
- Hershey's ratio has been variable in the past ten years. The cash coverage ratio was between 0.45-0.80x between 2011 – 2015. However, most recently, Hershey’s ratio has dipped to around 0.156x
Example 3 - Colgate
Let us now take another example of Colgate
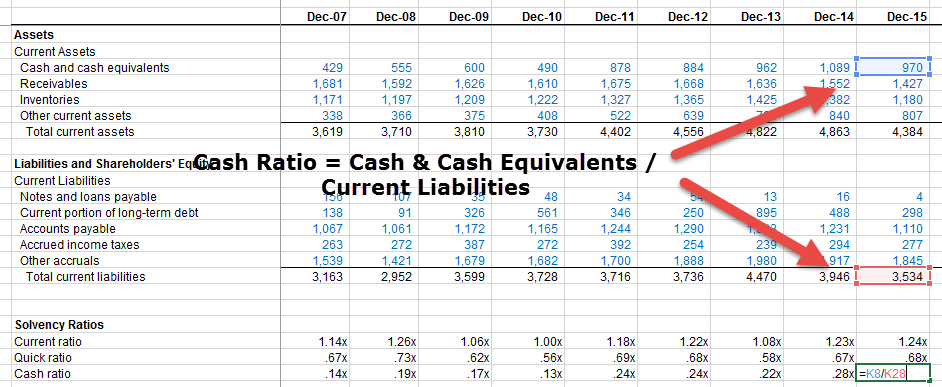
source: ycharts
Colgate has maintained a healthy ratio of 0.1x to 0.28x in the past ten years. With this higher cash ratio, the company is better positioned to pay off its current liabilities.
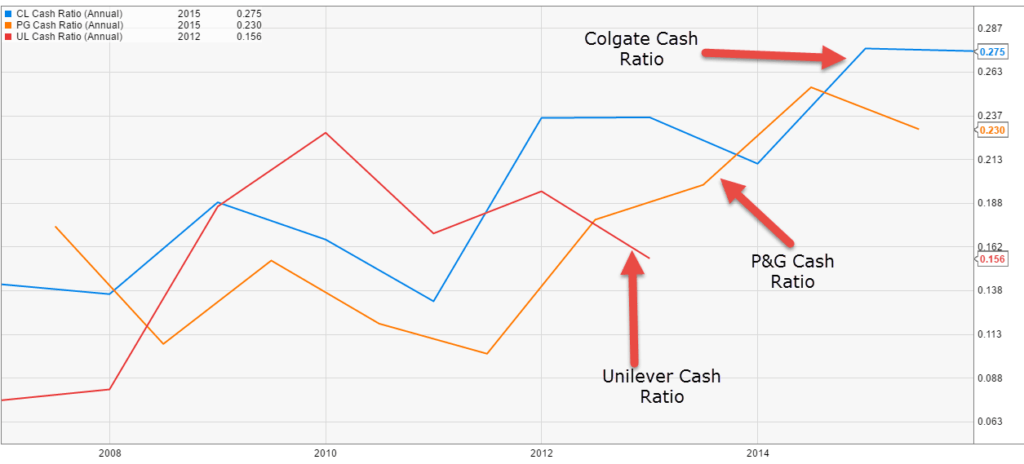
Below is a quick comparison of the cash coverage ratio of Colgate vs. P&G vs. Unilever.
source: ycharts
- Compared to its peers, Colgate's ratio seems to be much superior.
- Unilever’s ratio has been declining in the past 5-6 years.·
- P&G ratio has steadily improved over the past 3-4 years period.
Relevance and Use
- Creditors are more likely to look at the company's cash ratio than the investors as it guarantees whether the Company can service its debt or not. Since the ratio does not use inventory and accounts receivables, the creditors are assured that their debt is serviceable if the ratio is greater than 1.
- Accounts receivables can take weeks or months to be converted to cash, and inventory may take months to be sold; however, cash is the best form of an asset used to pay off the liabilities. Hence, creditors take solace and provide loans to Companies with better cash ratios.
- Although the creditors prefer a higher cash ratio, the Company does not keep it too high. A cash ratio of more than 1 suggests that the Company has too high cash assets. It is not able to be used for profitable activities. Companies do not maintain high cash assets because idle cash in bank accounts does not generate good returns. Hence, they try to use it for projects, acquiring new businesses, mergers, acquisitions, research, and development to generate better returns. Due to this reason, a cash ratio in the range of 0.5-1 is considered good.
- Although the cash ratio is a stringent liquidity measure, the investors do not look at the ratio very frequently during a fundamental analysis of the Company. Investors would like the company to utilize its idle cash to generate more profit and income.
- The investors are better off if the company pays off its debt in time and uses idle cash to reinvest in the business activities and generating better returns.
Limitations
From the above discussion, it’s clear that the cash coverage ratio could be one of the best-measuring grids of liquidity for a firm. But there are a few limitations of this ratio, which may become the reason for its infamous nature.
- First of all, most companies think that the usefulness of the cash coverage ratio is limited. Even a company with a lower ratio may portray a much higher current and quick ratio at the end of the year.
- In some countries, the ratio of less than 0.2 is healthy.
- As the cash coverage ratio portrays two perspectives, it isn’t easy to understand which perspective to look at. If this company's ratio is less than 1, what would you understand? Has it utilized its cash well? Or does it have more capacity to pay off short-term debt? That’s why, in most financial analyses, the cash coverage ratio is used along with other ratios like Quick Ratio and Current Ratio.
Recommended Articles
Frequently Asked Questions (FAQs)
To improve its cash ratio, a company must try to have more cash on hand in short-term liquidation or payment demand. It includes turning over inventory faster, retaining less, or not paying expenses in advance. Even a company may decrease short-term liabilities.
Normally, a ratio above one is considered suitable, while a ratio under 0.5 is unsafe since the entity has twice as much short-term debt in the cash form.
The cash ratio of banks means the cash ratio to banks' total liabilities. In addition, it implies the cash the bank has kept and estimates the credit made from the deposits. Therefore, the high cash ratio suggests that the bank is less profit-making, and the low cash ratio indicates that the bank is unsafe.
Conclusion
Having discussed the limitations, the cash ratio could be less useful than other liquidity ratios. But if you still want to check how much cash is lying around in your company, it's good to use this guide to determine the cash ratio on your own.
