Table of Contents
Beneish M-Score Formula
Eight different types of indices are weighted together as per the following formula to derive the M-Score:
Beneish M Score Formula = -4.84 + 0.92 * DSRI + 0.528 * GMI + 0.404 * AQI + 0.892 * SGI + 0.115 * DEPI – 0.172 * SGAI + 4.679 * TATA – 0.327 * LVGI
Beneish M-Score Definition
Beneish M-Score is the mathematical model Professor Messod Beneish created. One may use it to determine whether the company has manipulated its earnings with the help of the different financial ratios and the eight mentioned variables.
The eight variables required for calculating the M-Score using the data from the company’s income statement, balance sheet, and cash flows. Then, calculated the M-Score to know the company’s degree of manipulation in earnings.
- If Beneish M-Score is less than -2.22, the company under consideration is not a manipulator.
- If Beneish M-Score is more than -2.22, it signals that the company can be the manipulator.
Key Takeaways
- Beneish M-Score is the mathematical model introduced by Professor Messod Beneish.
- It can be utilized to know whether the company has manipulated the earnings through various financial ratios and the eight mentioned variables.
- If the Beneish M-Score is less than -2.22, the company under consideration is not a manipulator. On the other hand, suppose Beneish M-Score is more than -2.22; it indicates that the company can be the manipulator.
- M-Score consists of two versions: 8 variable models and 5 variable models. The 8-variable Beneish’s model is the most widely used of the two versions.
- However, since it is the probabilistic model, one cannot identify the manipulation with the 100-5 accuracies.
Components of Beneish M-Score
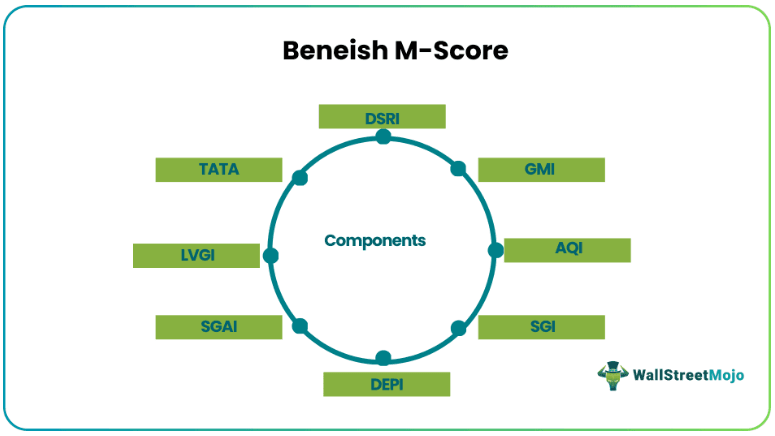
The Beneish M-Score is calculated based on the combination of eight different types of indices, which have been discussed below. However, before we dive deeper into the components that help perform calculations related to this model, it is important to understand that this model doesn't work when financial ratios are unknown.
In short, the Beneish M-Score model requires the calculation of financial ratios to work further and conduct the required analysis. If you want to have a better understanding of these ratios, checking out this Ratio Analysis Course can help you.
Now, let's check the indices in brief:

#1 – Days Sales in Receivables Index (DSRI)
It is the ratio of days sales in receivables in a year concerning the previous year. The large increase in the value of DSR is an indicator of revenue inflation.
DSRI = (Net Receivablest / Salest) / Net Receivables t-1 / Sales t-1)
#2 – Gross Margin Index (GMI)
It is the ratio of the year’s gross margin concerning the previous year.
GMI = /
#3 – Asset Quality Index (AQI)
The ratio of non-current assets (other than the plant, property, and the equipment) to total assets of a year versus the prior year.
AQI = /
#4 – Sales Growth Index (SGI)
It is the ratio of sales of a year to the previous year.
SGI = Salest / Salest-1
#5 – Depreciation Index (DEPI)
The ratio of the depreciation rate of a year to the previous year.
DEPI = (Depreciation t-1/ (PP&E t-1 + Depreciation t-1)) / (Depreciation t / (PP&E t + Depreciation t))
#6 – Sales, General, and Administrative expenses Index (SGAI)
It is the ratio of SG&A expenses of a year to the previous year.
SGAI = (SG&A Expense t / Sales t) / (SG&A Expense t-1/ Sales t-1)
#7 – Leverage Index (LVGI)
It is the ratio of total debt to total assets of a year concerning the previous year.
LVGI = /
#8 – Total Accruals to Total Assets (TATA)
It is calculated as the change in working capital accounts other than the cashless depreciation.
TATA = (Income from the Continuing Operations t – Cash Flows from the Operations t) / Total Assets t
Beneish M Score Formula
Calculation of Beneish M-Score (with Examples)
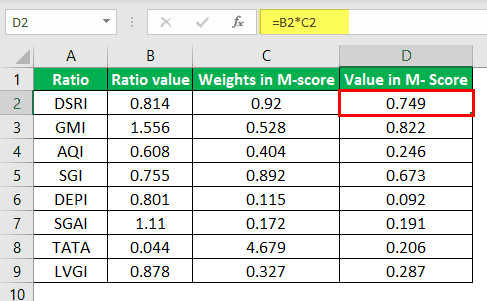
The following are the different Beneish ratios. Calculate the M-Score.
- DSRI : 0.814
- GMI : 1.556
- AQI : 0.608
- SGI : 0.755
- DEPI : 0.801
- SGAI : 1.110
- LVGI : 0.878
- TATA : 0.044
Calculation of M-Score
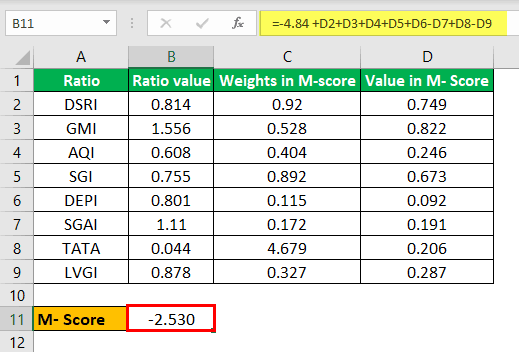
M-score= -4.84 + 0.92 * DSRI + 0.528 * GMI + 0.404 * AQI + 0.892 * SGI + 0.115 * DEPI – 0.172 * SGAI + 4.679 * TATA – 0.327 * LVGI

The M-score= -4.84 + 0.749 + 0.822 + 0.246 + 0.673 + 0.092 – 0.191 + 0.206 – 0.287

M-score= -2.530
In this case, since the M-Score is -2.53, which is less than -2.22, it implies that the company is not a manipulator.
Advantages of the Beneish M-Score
- It helps know to what extent the company’s management is manipulating its earnings as it calculates the degree of manipulation in earnings.
- It helps analysts in detecting financial accounting frauds in the company.
Disadvantages of the Beneish M-Score
- The probabilistic model only gives the user the probability of manipulation and cannot detect the companies that manipulate financial statements.
- The model does not apply to financial firms as Professor Messod Beneish did not include these firms at the time of estimating the model.
- If the management of the company has an idea about the calculation of the Beneish M-Score model, then they would manipulate the balance sheet entries considered for the calculation of M-Score. So, the purpose of the M- Score, in that case, will remain unfulfilled.
Important Points
- M-Score has two versions: 8 variable models and 5 variable models. The most widely used of the two versions is 8 variable Beneish’s model.
- Being the probabilistic model, one cannot detect the manipulation with the 100 5 accuracies.
Conclusion
M-Score calculates the degree of manipulation in earnings by the company. For example, many companies can use different means of increasing their reported earnings, like capitalizing the expenses of revenue, early booking of the sales in the books of accounts, etc. Although these tricks are not illegal by the law, they signify the wrong working of the company. The Beneish M-Score model helps analysts in predicting these high-profile failures.

