Table Of Contents
Poisson Distribution Definition
Poisson distribution refers to the process of determining the probability of events repeating within a specific timeframe. The variables for this probability distribution must be countable, random, and independent.

This statistical tool is used to understand future possibilities and trends. It is used by business organizations, financial analysts, market researchers, astronomists, scientists, physiologists, sports authorities, and government agencies. It was first introduced by Siméon Denis Poisson in 1830. Using this method, the French mathematician calculated the probability of success in gambling.
Key Takeaways
- Poisson distribution is a uni-parametric probability tool used to figure out the chances of success, i.e., determining the number of times an event occurs within a specified time frame.
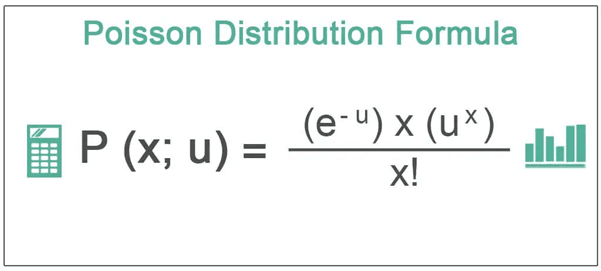
- The formula for Poisson distribution is P(x;μ)=(e^(-μ) μ^x)/x!.
- A distribution is considered a Poisson model when the number of occurrences is countable (in whole numbers), random and independent. In other words, it should be independent of other events and their occurrence.
- Also, Mean of X ∼P(μ) = μ; Variance of X ∼P(μ) = μ; and Standard Deviation of X ∼P(μ) = +√μ.
How Does Poisson distribution Work?
Poisson distribution is nothing but a prediction of an event taking place within a given period. The possibility of an event occurring a specified number of times is ascertained for the given timeframe. For instance, the chances of having a particular number of heartbeats within a minute is a probability distribution. Consider another example, assume that a hospital wants to restructure the staffing of its emergency ward. Say the hospital receives three emergency cases daily. The administration uses Poisson distribution to determine the possibility of admitting five emergency cases in a day to recruit a backup of staff.
This statistical tool is uni-parametric. As a result, knowing the average variable of an event's occurrence can be used to determine other possibilities. Poisson distribution can also be represented as X ∼ P(μ). Moreover, we can also find its mean, variance, and standard deviation using the following equations:
- Mean of X ∼P(μ) = μ
- The variance of X ∼P(μ) = μ
- Standard Deviation of X ∼P(μ) = +√μ
The results of two Poisson distributions can be summed up to acquire the probability of a broader random variable. That is, X1∼P(μ1) and X2∼P(μ2) can provide the value of a third variable Y. Here, Y = X1+X2∼P (μ1+ μ2). For example, assume that a hockey team wins two matches on an average for every five games played. What would be the probability of winning one competition this year? The team can either win 0 or 1 match. Thus, to calculate the desired results, add up both the probabilities. That is, add up the probability of winning zero matches and the probability of winning one match.
In 1830, the Poisson distribution model was introduced by Siméon Denis Poisson. He was a French mathematician who figured out the chances of success in gambling using this method. However, it was an unpopular tool among the gamblers. Nevertheless, the concept gained significance in the field of statistics after World War II. The British statistician, R.D. Clarke, used this tool to help the British government gain insights into German bomb attacks on London. Clarke analyzed that the Germans dropped the bombs randomly. Clarke concluded that the attacks did not specify a region or city.
Poisson Distribution Formula
This probability distribution determines the chance of an event's repetition within a specified time interval. The formula is as follows:

Here, P (x; μ) is the probability that an event will occur a specific number of times in a certain period;
- e denotes the Euler's number whose fundamental value is 2.72;
- µ is the average number of occurrences in a certain period; and
- x! is the factorial of the number of occurrences for which the probability is being determined.
Calculation with Graph
Consider the following numerical to better understand the calculation involved in this mathematical tool.
A watch manufacturing company wants to reduce the number of defective pieces. It took an average of 100 lots and found that 7 watches from each lot were defective. What would be the probability of 10 watches being defective in a single lot?
Solution:
Given:
Average number of defective watches in a lot (µ) = 7
Expected number of defective watches in a particular lot (x) = 10
P (x;μ) = /x!
P (10;7) = /10!
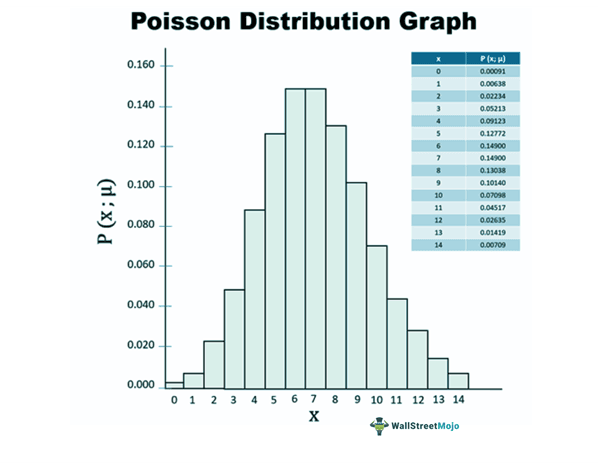
P (10;7) = 0.07098 or 7.098%
Thus, the probability that a particular lot has 10 defective watches is 7.098%.
Poisson Distribution Graph
With the same example, let us chart the probability of having 0,1, 2, 3, 4, 5, 6, 7, 8, 9, 10, 11, 12, 13, 14 defective watches on a graph.

Poisson Distribution Excel Examples
Consider this simple excel example to better understand how the Poisson distribution formula is applied.
Example #1
The average occurrence of an event in a given time interval is 10. What would be the probability of that event occurring 15 times?
In this example, u = average number of occurrences of event = 10
And x = 15

Therefore, the calculation for poisson distribution can be done as follows,

P (15;10) = e^(-10)*10^15/15!

P (15;10) = 0.0347 = 3.47%
Hence, there is a 3.47% probability of that event occurring 15 times.
Example #2
Another use of the Poisson formula is in the Insurance Industry. A company that is in the insurance business determines its premium amount based on the number of claims and amount claimed per year. So, to evaluate its premium amount, the insurance company will determine the average number of a claimed amount per year. Then based on that average, it will also determine the minimum and the maximum number of claims that can reasonably be filed in the year. Based on the maximum number of the claim amount and the cost and profit from the premium, the insurance firm will determine what kind of premium amount will be good to break even.
Let's say the average number of claims handled by an insurance company per day is 5. It will find out what is the probability of 10 claims per day.

Therefore, the calculation can be done as follows,

P(10;5) = e^(-5). 5^10/10!

P(10;5) = 1.81%
Hence there is very little probability that the company will have 10 claims per day. Based on this data, the company can decide on a premium amount.
Poisson Distribution Applications
Poisson distribution is advantageous in forecasting, tracking, and improving the efficiency of a company. It is frequently applied to evaluate the business performance and guide the organizational efforts to attain operational efficiency. For example, the management can determine the peak hours of sales and customer service efficiency to plan the workforce requirement. This way, periods of rush and hustle can be handled comfortably.
This statistical tool is highly effective in checking the feasibility and viability of an insurance cover. It involves analyzing various factors like the probability of accidents, the cost of insurance cover, the number of times a claim can be raised, whether the company is over-insured, or whether a company is under-insured. Further, employing this method, the production managers control wastage by keeping track of the number of defective products in each round of manufacturing.
It is an equally crucial tool in the field of finance for stock analysts and market predictions. It helps determine the risk level associated with securities investment. This is achieved by ascertaining the possibilities of market downfall in a specified period. This method even facilitates the analysis of investor behavior and investment frequency.

