What is Binomial Distribution Formula?
The binomial distribution formula calculates the probability of getting x successes in the n trials of the independent binomial experiment. The probability is derived by a combination of the number of trials. First, the number of successes is represented by nCx. Then, it is multiplied by the probability of the success raised to the power of the number of successes. It is represented by px. Further, it is multiplied by the probability of the failure raised to the power of the difference between the number of successes and the number of trials represented by (1-p) n-x.
Binomial distribution formula statistics is represented by px. Further, it is multiplied by the probability of the failure raised to the power of the difference between the number of successes and the number of trials represented by (1-p) n-x. This helps researchers and analysts determine one of the two independent values that can arise out of the experiment.
Binomial Distribution Explained
Binomial distribution is a fundamental concept in probability and statistics. It refers to the tool or technique used for obtaining a specific number of positive outcomes in a fixed number of independent trials.
The binomial distribution formula statistics is particularly useful when there are only two possible outcomes for each trial- success or failure. It is often relied upon in research where the outcomes are binary.
These distributions are determined by two primary parameters- one, the number of trials 9N) and two, the probability of success in a single trial (p). These parameters shape the characteristics of the distribution within a data set.
Understanding of the concept and its applicability is useful for professionals of different fields such as finance, quality control, and even biology. It helps analysts, professionals, and researchers make predictions based on probability about the likelihood of achieving a specific number of positive outcomes or successes in a specific number of trials.
In the world of business, it can be applied more often than any other area of work as in the business world, things are often a success or a failure. Therefore, imagine applying this formula to a marketing campaign or a new product launch. It gives businesses a clearer idea of what might be a better course of action.
Formula
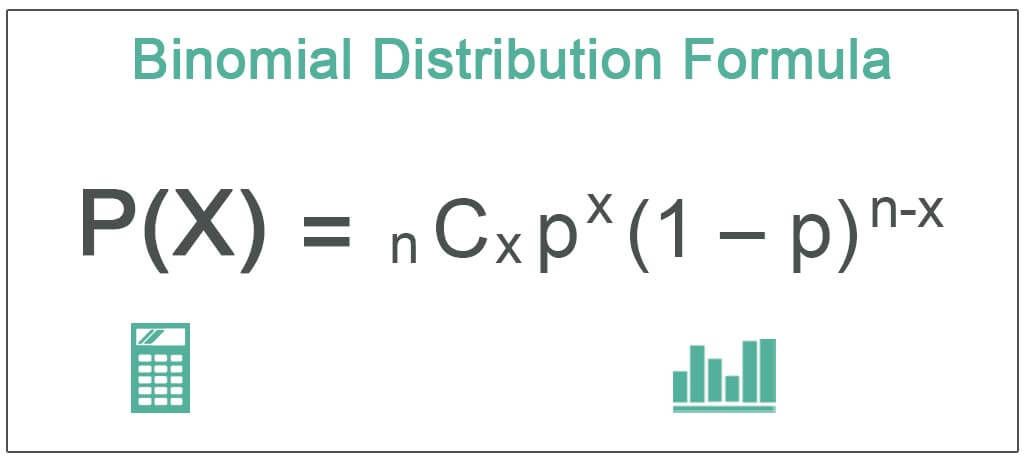
The probability of obtaining x successes in n independent trials of a binomial experiment is given by the following formula of binomial distribution:
P(X) = nCx px(1-p)n-x
where p is the probability of success
In the above equation, nCx is used, which is nothing but a combination formula. The formula to calculate combinations is given as nCx = n! / x! (n-x)! where n represents the number of items (independent trials), and x represents the number of items chosen at a time (successes).
In case n=1 is in a binomial distribution formula probability; the distribution is known as the Bernoulli distribution. The mean of a binomial distribution is np. The variance of the binomial distribution is np(1-p).
How To Calculate?
One can derive the calculation of binomial distribution formula statistics by using the following four simple steps:
- Calculate the combination between the number of trials and the number of successes. The formula for nCx is where n! = n(n-1)(n-2) . . . 21. For a number n, the factorial of n can be written as n! = n(n-1)! For instance, 5! is 5432*1
- Calculate the probability of success raised to the power of the number of successes that are px.
- Calculate the probability of failure raised to the power of the difference between the number of successes and the number of trials. The probability of failure is 1-p. Thus, this refers to obtaining (1-p) n-x
- Find out the product of the results obtained in Step 1, Step 2, and Step 3.
Variance
The variance of a binomial distribution formula probability shows us the dispersion of the probability distribution. In simple words, it shows us the spread within the probability distribution of a data set.
It is vital to note two points with respect to the interpretation of the variance. They are:
- The variance increases with an increase in the number of attempts, formally known as trials (n), reflecting a better potential for variability.
- Variance is influenced by the success probability (p), leading to different levels of dispersion.
In the world of business and finance, this plays a pivotal role in risk assessment and provides unparalleled insights into the range of possible results.
Examples
Now that we understand the formula, how to calculate, and the variance of binomial distribution formula statistics, let us understand its practical application through the examples below.
Example #1
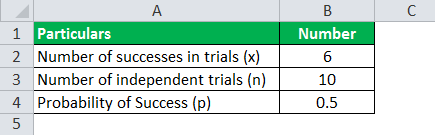
The number of trials (n) is 10. The probability of success (p) is 0.5. Do the binomial distribution calculation to calculate the probability of getting six successes.
Solution:
Use the following data for the calculation of binomial distribution.
Calculation of binomial distribution can be done as follows:
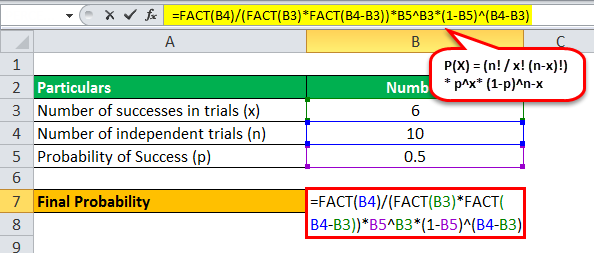
P(x=6) = 10C6*(0.5)6(1-0.5)10-6
= (10!/6!(10-6)!)*0.015625*(0.5)4
= 210*0.015625*0.0625
Probability of Getting Exactly 6 Successes will be:
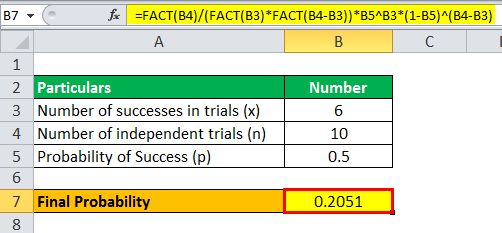
P(x=6) = 0.2051
The probability of getting exactly 6 successes is 0.2051.
Example #2
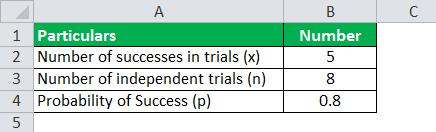
A manager of an insurance company goes through the data of insurance policies sold by insurance salesmen working under him. He finds that 80% of the people who purchase motor insurance are men. He wants to determine if 8 motor insurance owners are randomly selected. What would be the probability that exactly 5 of them are men?
Solution: We first have to find out what are n, p, and x.
Calculation of binomial distribution can be done as follows,
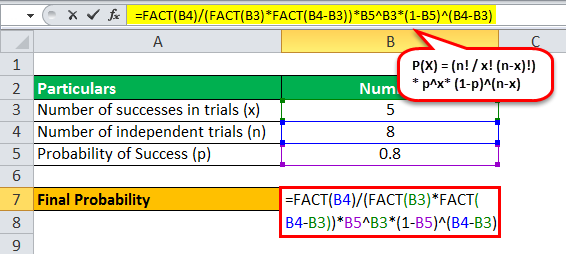
P(x=5) = 8C5*(0.8)5(1-0.8)8-5
= (8! /5! (8-5)! )*0.32768*(0.2)3
= 56*0.32768*0.008
Probability of Exactly 5 Successes will be-
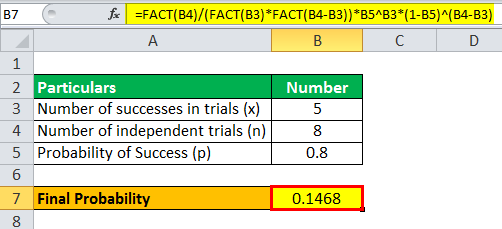
P(x=5) = 0.14680064
The probability of exactly 5 motor insurance owners being men is 0.14680064.
Example #3
Hospital management is excited about introducing a new drug for treating cancer patients as the chance of a person being successfully treated by it is very high. The probability of a patient being successfully treated by the drug is 0.8. The drug is given to 10 patients. Find the probability of 9 or more patients being successfully treated by it.
Solution: We first have to find out what is n, p, and x.
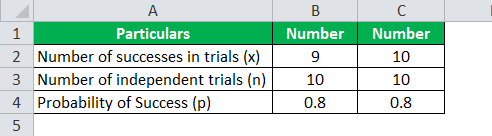
We have to find the probability of 9 or more patients being successfully treated. Thus, either 9 or 10 patients are successfully treated by it.
x (a number that you have to find a probability for) = 9 or x = 10
We have to find P(9) and P(10)
Calculation of binomial distribution to find P(x=9) can be done as follows,
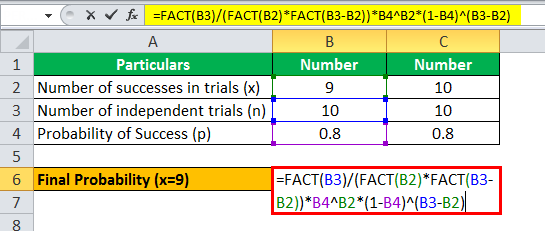
P(x=9) = 10C9*(0.8)9(1-0.8)10-9
= (10! /9! (10-9)!)*0.134217728*(0.2)1
= 10*0.134217728*0.2
Probability of 9 Patients will be-
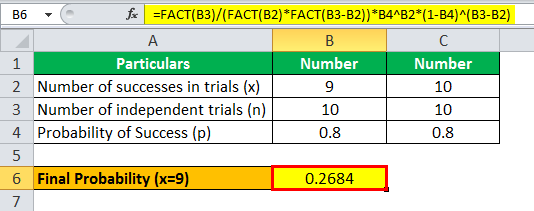
P(x=9) = 0.2684
Calculation of binomial distribution to find P(x=10) can be done as follows,
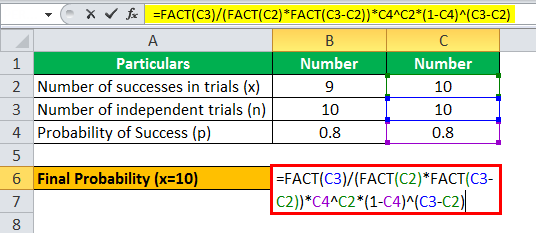
P(x=10) = 10C10*(0.8)10(1-0.8)10-10
= (10!/10! (10-10)!)*0.107374182*(0.2)0
= 1*0.107374182*1
The probability of 10 Patients will be-
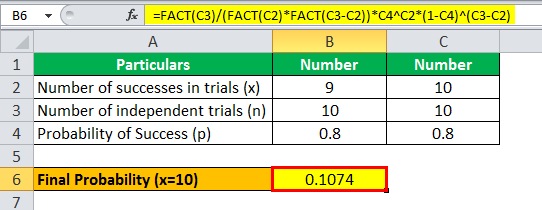
P(x=10) = 0.1074
Therefore, P(x=9)+P(x=10) = 0.268 + 0.1074
= 0.3758
Thus, the probability of 9 or more patients being treated with the drug is 0.375809638.
Relevance and Use
Now that we have a clear understanding of the concept and its intricacies, let us understand its relevance and uses in the modern day through the points below.
- There are only two outcomes
- The probability of each outcome remains constant from trial to trial
- There are a fixed number of trials.
- Each trial is independent, i.e., mutually exclusive of others.
- It provides us with the frequency distribution of the possible number of successful outcomes in a given number of trials where each has the same probability of success.
- Each trial in a binomial experiment can result in just two possible outcomes. Hence, the name is ‘binomial.’ One of these outcomes is known as success, and the other as a failure. For instance, sick people may respond to a treatment or not.
- Similarly, when tossing a coin, we can have only two outcomes: heads or tails. The binomial distribution is a discrete distribution used in statistics, which is different from a continuous distribution.
An example of a binomial experiment is tossing a coin, say thrice. When we flip a coin, only two outcomes are possible – heads and tails. The probability of each outcome is 0.5. Since the coin is tossed thrice, the number of trials is fixed, that is 3. Other tosses do not influence the probability of each toss.
Binomial distribution finds its applications in social science statistics. It is used to develop models for dichotomous outcome variables with two outcomes. An example of this is whether Republicans or Democrats would win the election.
Binomial Distribution Formula in Excel (with excel template)
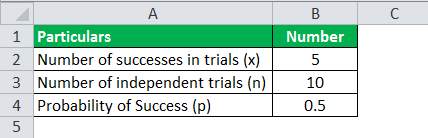
Saurabh learned about the binomial distribution equation in school. He wants to discuss the concept with his sister and have a bet with her. He thought that he would toss an unbiased coin ten times. He wants to bet $100 on getting five tails in 10 tosses. For this bet, he wants to compute the probability of getting exactly five tails in 10 tosses.
Solution: We first have to find out what is n, p, and x.
There is an inbuilt formula for binomial distribution in Excel, which is:
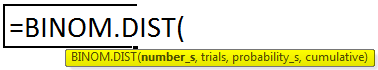
It is BINOM.DIST(number of successes, trials, probability of success, FALSE).
This example of the binomial distribution would be
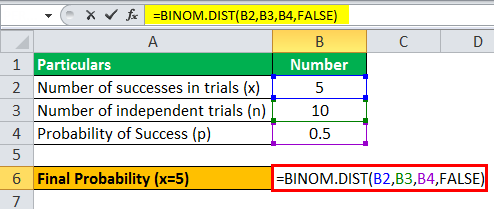
=BINOM.DIST(B2, B3, B4, FALSE) where cell B2 represents the number of successes, cell B3 represents the number of trials, and cell B4 represents the probability of success.
Therefore, the calculation of Binomial Distribution will be-
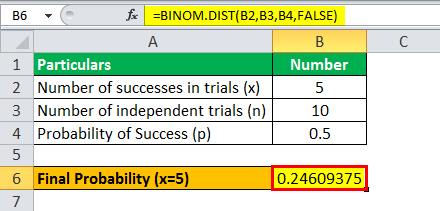
P(x=5) = 0.24609375
The probability of getting exactly 5 tails in 10 tosses is 0.24609375
Note: FALSE in the above formula denotes the probability mass function. It calculates the probability of exactly n successes from n independent trials. TRUE denotes the cumulative distribution function. It calculates the probability of at most x successes from n independent trials.
Recommended Articles
This article has been a guide to what is Binomial Distribution. Here we explain how to calculate it, examples, variance, relevance and uses in detail. You can learn more about Excel modeling from the following articles: –