What is Positively Skewed Distribution?
The positively skewed distribution is a distribution where the mean, median, and mode of the distribution are positive rather than negative or zero, i.e., data distribution occurs more on the one side of the scale with a long tail on the right side. It is also known as the right-skewed distribution, where the mean is generally to the right side of the data median.
Key Takeaways
- A positively skewed distribution is characterized by a distribution where the data’s mean, median, and mode are greater than zero. It indicates that the data is concentrated more toward one side of the scale, with a long tail on the right side.
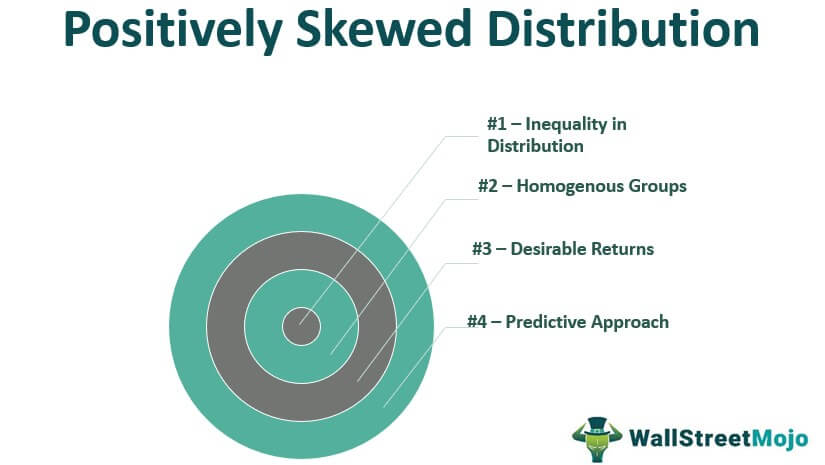
- Causes of a positively skewed distribution include factors such as inequality in data distribution, homogeneous groups, desirable returns, and a predictive approach.
- In a positively skewed distribution, the mean is greater than the median. This occurs because the data is skewed towards lower values, pulling the mean towards that side, while the median remains closer to the middle of the data.
Example
Income distributes positively if more population falls in the normal or lower-income earning group rather than a few high-earning income groups. In addition, they show the mean is greater than the median.
Below are the data taken from the sample. In the first column, given the income category. And in the second column, the number of persons falling in the respective income group is given. Next, calculate the mean, median, and mode and analyze whether it is an example of a positively skewed distribution.

Solution:
Calculation of the mean, median and mode:
#1 – Mean:
Mean of the data is:
- Mean = (100 + 150 + 500 + 1,000 + 1,500 + 2,000 + 3,000 + 4,000 + 5,000 + 6,000) / 10
- Mean = 2,325
#2 – Median:
- Median Value =(10 + 1 / 2) th value
- Median Value = 5.5th value, i.e., average of 5th and 6th value
- Median = (1,500 + 2,000) / 2
- Median = 1,750
#3 – Mode:
The mode will be the lowest value in the data set, which is 150 in the present case.
Hence,
- Mean > Median > Mode
- 2,325 > 1,750 > 150
The mean is greater than the median in positively distributed data, and most people fall on the lower side. The same is the case in the above example.
What Causes Positively Skewed Distribution?

#1 – Inequality in Distribution
The amount of money earned by everyone will differ. Earning depends upon working capacity, opportunities, and other factors. Similarly, the probability of any outcome is different. Hence, the main cause of positively skewed distribution is unequal distribution.
#2 – Homogenous Groups
The positive distribution reflects the same line of groups. That is, there is a more or less homogenous kind of outcome like in the case of the positive income distribution, the population in the lower or middle earning groups, i.e., the earning is more or less homogenous.
#3 – Desirable Returns
In finance, if the returns are desirable, they are said to be positively distributed. In positive distribution, the chances of profits are more than the loss.
#4 – Predictive Approach
The predictive approach towards data distribution into groups also causes such a distribution.
Positively Skewed Distribution Mean and Median
In a positively skewed distribution, the mean is greater than the median as the data is more towards the lower side and the mean average of all the values. In contrast, the median is the middle value of the data. So, if the data is more bent towards the lower side, the average will be more than the middle value.
Let’s take the following example for better understanding:
- 50, 51, 52, 59 shows the distribution is positively skewed as data is normally or positively scattered range.
- The mean of the data provided is 53 (average, i.e., (50+51+52+59)/4).
- Median is (n+1/2) Value, i.e. (4+1/2), i.e., 2.5, i.e., the median is average of 2nd value and 3rd value.
- Median is (51+52)/2 = 51.5
- As the mean is 53 and the median is 51.5, the data is said to be positively skewed.
Central Tendency in Positively Skewed Distribution
Central Tendency is the mean, median, and mode of the distribution. The mean, median, and mode are equal in the normal skewed distribution data. Whereas the central tendency of positively skewed data has the following equation:
The mean is average, the median is the middle value, and the mode is the highest value in the data distribution. Therefore, the results bent towards the lower side as in this data type. Hence, the mean will be more than the median as the median is the middle value, and the mode is always the highest value. Therefore, any skewness is always greater than the mean and median.
Conclusion
It is the type of distribution where the data is more toward the lower side. That means there are more or less homogenous types of groups. In a positively skewed distribution, most values on the graph are on the left side, and the curve is longer towards the right trail. In this distribution, the mean is greater than the median. In finance, it is the chance for more profits than the loss. In the case of income distribution, if most population earns in the lower and middle range, then the income is said to be positively distributed. Uneven distribution is the main cause for determining the positive or negative distribution.
Frequently Asked Questions (FAQs)
What is a negative vs. positively skewed distribution?
In statistics, a negatively skewed distribution is one in which the tail of the distribution extends toward the lower values. In comparison, a positively skewed distribution has a tail that extends toward the higher values. In other words, negative skewness indicates a concentration of data toward higher values, while positive skewness indicates a concentration toward lower values.
Is a positively skewed distribution good or bad?
A positively skewed distribution is neither inherently good nor bad. Skewness is simply a measure of the shape of the distribution. Whether it is good or bad depends on the context and the specific analysis. For example, a positively skewed distribution may be desirable in some cases, such as when examining income distribution where higher incomes are concentrated.
Why is a positively skewed distribution the best measure of central tendency?
A positively skewed distribution is not necessarily the “best” measure of central tendency. In fact, central tendency is typically represented by the mean, median, or mode. However, the mean is usually greater than the median in a positively skewed distribution since the tail pulls the mean towards higher values. This can be important to consider when interpreting and understanding the distribution. The choice of the most appropriate measure of central tendency depends on the specific distribution and the goals of the analysis.
Recommended Articles
This article has been a guide to what is Positively Skewed Distribution and its definition. Here, we discuss a positively skewed distribution with causes and graphs. You may also have a look at the following articles: –