What Is T Distribution Formula?
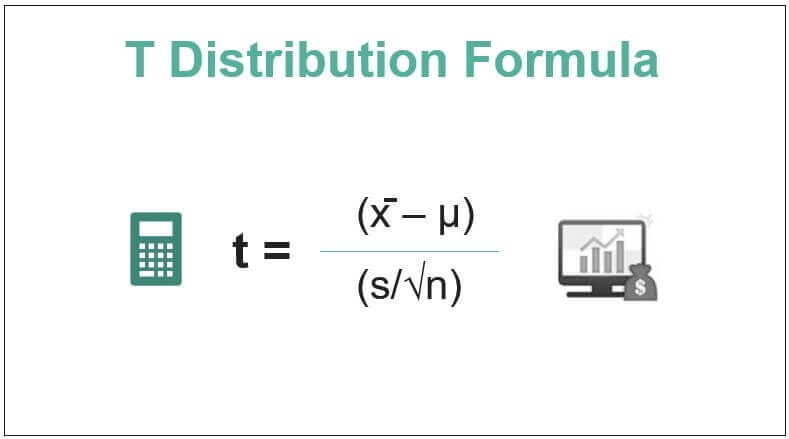
The T-distribution formula (also popularly known as the student’s T-distribution formula) reflects the importance of one single population or option over others when the variance is unknown. It is calculated by subtracting the population mean (mean of the second sample) from the sample mean (mean of the first sample) that is [ x̄ – μ] which is then divided by the standard deviation of means. It is initially divided by the square root of n, the number of units in that sample [ s ÷ √(n)].
The T-distribution is a kind of distribution that looks almost like the normal distribution curve or bell curve but with a bit fatter and shorter tail. When the sample size is small, it will use this distribution instead of the normal distribution.
Key Takeaways
- The T-distribution is a distribution that looks like the standard or bell curve but has a slightly fatter and shorter tail.
- If the sample size is small, it will use the distribution rather than a normal distribution.
- It is used in hypothesis testing to determine whether one must reject or accept the null hypothesis.
- The T-distribution formula eliminates the sample mean from the population mean, divides it by standard deviation, and multiples it by the sample size square root to standardize the value.
T Distribution Formula Explained
The T-Distribution formula calculates the mean of the population normally distributed. The student’s T-distribution calculation is quite simple, but the values are required. For example, one needs the population means, which is the universe means, which is nothing but the average population. Whereas the sample mean is required to test the authenticity of the population mean, whether the statement claimed based on population is true, and sample, if any, taken will represent the same statement. So, the T-distribution formula subtracts the sample mean from the population mean, divides it by standard deviation, and multiples it by the square root of the sample size to standardize the value.
The expression that helps assess how T-distribution should occur is mentioned below:
Where,
- x̄ is the sample mean
- μ is the population mean
- s is the standard deviation
- n is the size of the given sample
However, since there is no range for T-distribution calculation, the value can go weird, and we won’t be able to calculate probability as the student’s T-distribution has limitations in arriving at a value. Hence, it is only useful for a smaller sample size. Also, one needs to find that value from the student’s T-distribution table to calculate probability after arriving at a score.
The T-distribution formula, when applied, gives reliable results only when the sample taken into consideration is small in size. If the sample size is more, the T distribution appears like a normal distribution.
Examples
Let us consider the following examples to understand the concept and check how the entire distribution phenomenon actually occurs.
Example #1
Consider the following variables given to you:
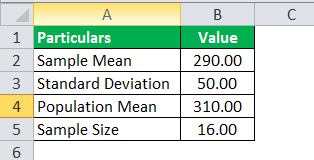
- Population mean = 310
- Standard deviation = 50
- Size of the sample = 16
- Sample mean = 290
Calculate the T-distribution value.
Solution:
Use the following data for the calculation of the T-distribution.
So, the calculation of the T-distribution can be as follows:
Here, given all the values. Then, we need to incorporate the values.
We can use the T-distribution formula:


Value of t = (290 – 310) / (50 / √16)
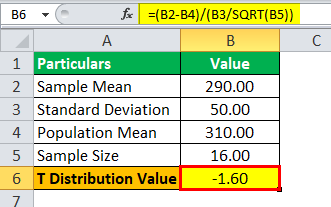
T Value = -1.60
Example #2
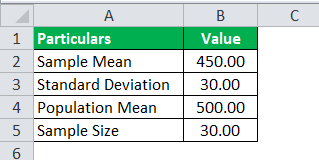
SRH company claims that its employees at the analyst level earn an average of $500 per hour. A sample of 30 employees at the analyst level was selected. Their average hourly earnings were $450, with a sample deviation of $30. And assuming their claim to be true, calculate the T-distribution value, which shall use to find the probability for T–distribution.
Solution:
Use the following data for the calculation of the T-distribution.
So, the calculation of the T-distribution can be as follows:
Here, we have all the values. So, we need to incorporate the values.
We can use the T-distribution formula:
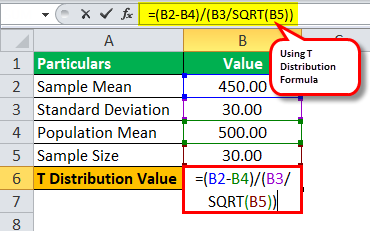
Value of t = (450 – 500) / (30 / √30)
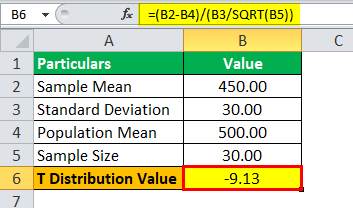
T Value = -9.13
Hence, the value for T-score is -9.13.
Example #3
Universal college board administered an IQ level test to 50 randomly selected professors. And the result they found was that the average IQ level score was 120 with a variance of 121. Assume that the t score is 2.407. What is the population mean for this test, which would justify the T-score value as 2.407?
Solution:
Use the following data for the calculation of the T-distribution.
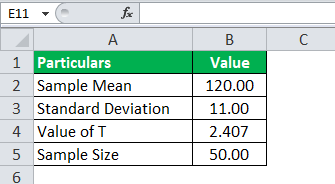
Here, all the values are given along with the T-value. This time, we need to calculate the population mean instead of the T-value.
Again, we will use the available data and calculate the population means by inserting the values in the formula below.
The sample mean is 120, the population means is unknown, the sample standard deviation will be the square root of the variance, which would be 11, and the sample size is 50.
So, the population mean(μ) calculation can be as follows:
We can use the T-distribution formula:

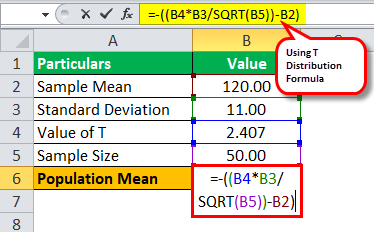
Value of t = (120 – μ ) / (11 / √50)
2.407 = (120 – μ ) / (11 / √50)
-μ = -2.407 * (11/√50)-120
Population Mean (μ) will be:
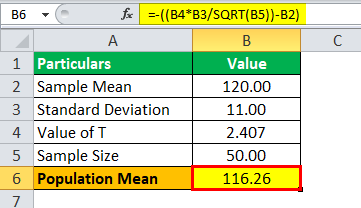
μ = 116.26
Hence, the value for the population mean will be 116.26.
Relevance and Use
The T-distribution (and those associated T-score values) is used in hypothesis testing when determining if one should reject or accept the null hypothesis.
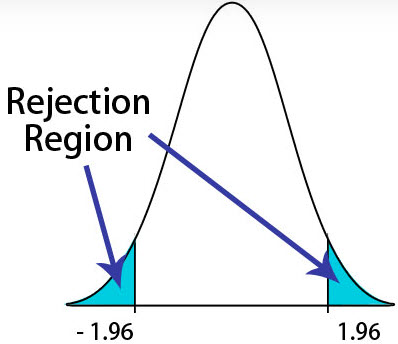
In the above graph, the central region will be the acceptance area, and the tail region will be the rejection region. In this graph, which is a two-tailed test, the blue shaded will be the rejection region. One can describe the tail region’s area with either the T-scores or the z-scores. For example, the image on the left will depict an area in the tails of five percent (which is 2.5% on both sides). The Z-score should be 1.96 (taking the value from the Z-table), representing that 1.96 standard deviations from the average or the mean. One can reject the null hypothesis if the value of the Z-score is less than the value of -1.96 or the value of the Z-score is greater than 1.96.
This distribution shall describe earlier when one has a smaller sample size (mostly under 30) or if one doesn’t know the population variance or standard deviation. It would always be the case for practical purposes (that is, in the real world). On the other hand, if the sample size is large enough, then the two distributions will be practically similar.
Frequently Asked Questions (FAQs)
What is T-distribution in statistics?
The T-distribution is an approach to express observations where most fall close to the mean, and the remaining makes the tails on one or the other side. It is a normal distribution for smaller sample sizes where the variance is unknown in the data.
What is the difference between T-distribution and F-distribution?
In the null hypothesis, the F-statistic uses Snedecor’s F-distribution. One may use the F-test for a broader range of sampled populations. The T-test compares the two sets of means to show whether the standard of one group is essentially different from the other group.
Does T-distribution have a mean of 0?
The T-distribution has a mean of 0, and the normal distribution believes that the population standard deviation is known.
Why do T-distributions tend to be flatter?
Usually, the T-distribution is bell-shaped, but smaller sample sizes display increased variability, i.e., flatter. In other words, the distribution is less pale than usual, with thicker tails. Moreover, the distribution reaches a normal distribution as the sample size increases.
Recommended Articles
This article is a guide to what is T Distribution Formula. Here, we explain the concept with examples and also discuss its relevance and uses. You can learn more about Excel modeling from the following articles: –