What Is A Standard Normal Distribution Formula?
The standard normal distribution is a type of probability distribution that is symmetric about the average or the mean, depicting that the data near the average or the mean occurs more frequently when compared to the data far from the average or the mean.
As the name implies, the standard normal distribution formula helps statisticians and researchers assess the nearest values to which the results would vary for similar types of instances. One may term a standard normal distribution score the “Z-score.”
Key Takeaways
- The standard normal distribution is a probability distribution type symmetric about the average or the mean.
- It depicts that the data near the average or the mean happens more repeatedly while comparing the data far from the average or the mean.
- One may term a standard normal distribution score the “Z-score.”
- The standard normal distribution is referred to as the Z distribution. It has the following properties: average or a mean of zero. In addition, it has a standard deviation equal to 1.
- A negative Z-Score shall indicate a score below the mean or the average. In contrast, A positive Z-Score shall show that the data point is above the mean or the average.
- The standard normal distribution follows the 68-95-99.70 rule, also called the empirical rule.
Standard Normal Distribution Formula Explained
A standard normal distribution formula lets users compute a standardized value. Hence, the users get an idea of the range of values to which the results could vary in a particular instance. The standard normal distribution, also referred to as the Z-distribution, has the following properties:
- It has an average or says a mean of zero.
- It has a standard deviation that is equal to 1.
Using the standard normal table, we can find the areas under the density curve. The Z-score is the score on the standard normal distribution. One should interpret it as the number of standard deviations where the data point is below or above the average or the mean.
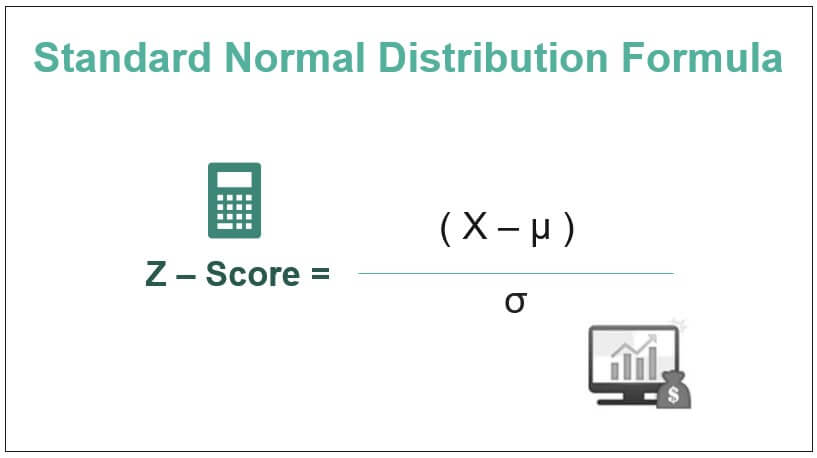
The standard normal distribution formula is below:
Where,
- X is a normal random variable
- µ is the average or the mean
- σ is the standard deviation

Then, we need to derive probability from the above table.
A negative Z-Score shall indicate a score below the mean or the average, while A positive Z-Score shall indicate that the data point is above the mean or the average.
The standard normal distribution follows the 68-95-99.70 rule, also called the Empirical Rule. Per that rule, sixty-eight percent of the given data or the values shall fall within 1 standard deviation of the average or the mean. In comparison, ninety-five percent shall fall within 2 standard deviations. Finally, the ninety-nine decimal seven percent of the value of the data shall fall within 3 standard deviations of the average or the mean.
Examples
Let us consider the following examples to understand the usage of the standard normal distribution formula:
Example #1
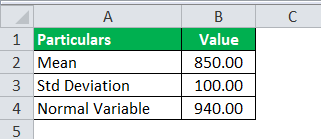
Consider the mean given to you, like 850, with a standard deviation of 100. You are required to calculate a standard normal distribution for a score above 940.
Solution:
Use the following data for the calculation of standard normal distribution.
So, the calculation of Z-score can be done as follows-
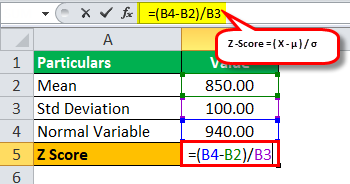
Z – score = ( X – µ ) / σ
= (940 – 850) / 100
Z Score obtained using standard normal distribution formula in Excel is –
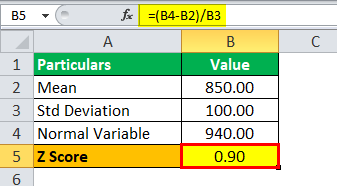
Z Score = 0.90
Using the above table of the standard normal distribution, we have a value of 0.90 as 0.8159. Therefore, we must calculate the score above P(Z >0.90).
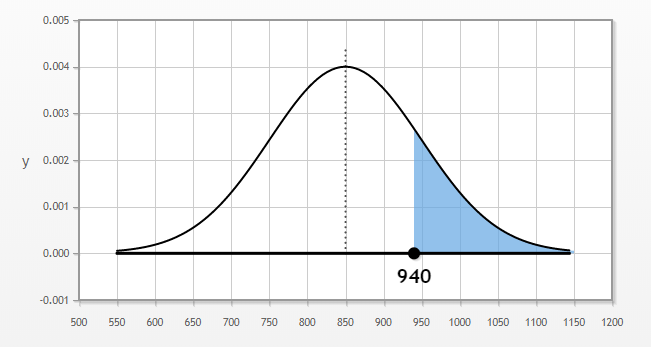
We need the right path to the table. Hence, the probability would be 1 – 0.8159, which equals 0.1841.
Thus, only 18.41% of the scores lie above 940.
Example #2
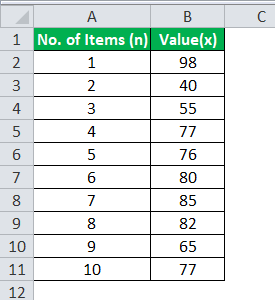
Sunita takes private tuition classes for mathematics subjects and currently has around 100 students. After the 1st test she took for her students, she got the following average numbers, scored by them, and ranked them percentile-wise.
Solution:
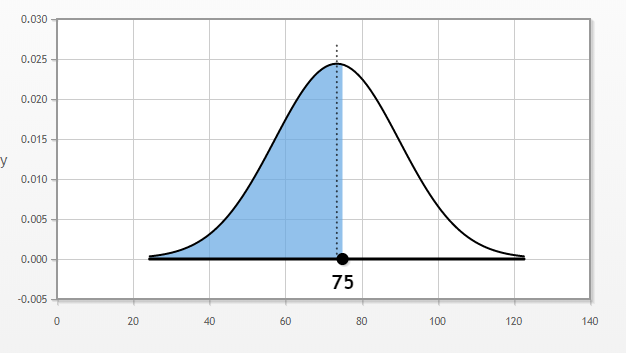
First, we plot what we are targeting, which is the left side of the cure. P(Z<75).
Use the following data for the calculation of standard normal distribution.
We need to calculate the mean and the standard deviation first.
The calculation of mean can be done as follows-
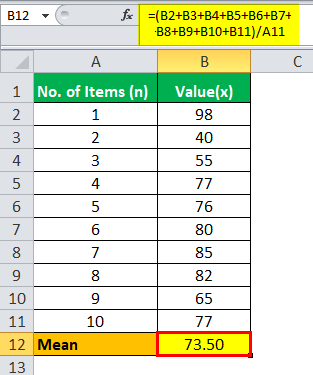
Mean = (98 + 40 + 55 + 77 + 76 + 80 + 85 + 82 + 65 + 77) / 10
Mean = 73.50
The calculation of standard deviation can be done as follows-
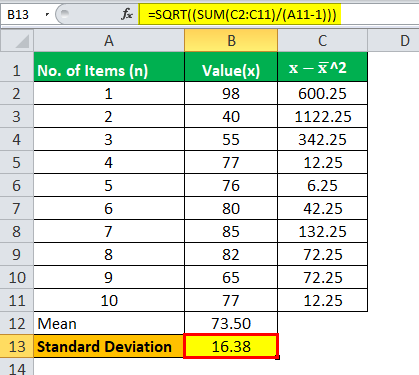
Standard deviation = √[∑(x – x) / (n-1)]
Standard deviation = 16.38
So, the calculation of Z-score can be as follows-
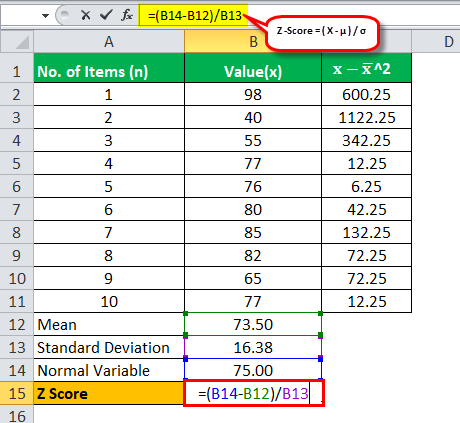
Z – score= ( X – µ ) / σ
= (75 – 73.50) / 16.38
Z Score will be –

Z Score = 0.09
Using the above table of standard normal distribution, we have a value of 0.09 as 0.5359, which is the value for P (Z <0.09).
Hence, 53.59% of the students scored below 75.
Example #3
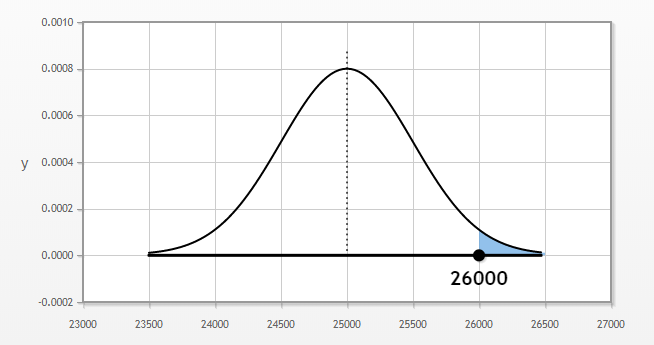
Vista Ltd. is an electronic equipment showroom. It wants to analyze its consumer behavior and has around 10,000 customers around the city. On average, the customer spends 25,000 when it comes to its shop. However, the spending varies as customers spend from 22,000 to 30,000. The average variance of around 10,000 customers that the management of Vista Ltd. has come up with is around 500.
The management of Vista Ltd. has approached you. They are interested to know what proportion of their customers spend more than 26,000. Assume that customers’ spending figures are normally distributed.
Solution:
First, we plot what we are targeting, which is the left side of the cure. P(Z>26000).
Use the following data for the calculation of standard normal distribution.
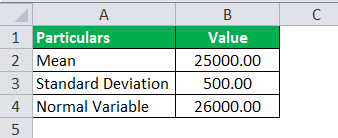
The calculation of z score can be as follows-
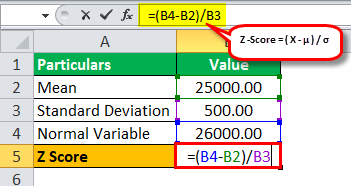
Z – score= ( X – µ ) / σ
=(26000 – 25000) / 500
Z-score will be-
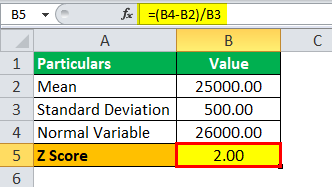
Z-score = 2
The calculation of standard normal distribution can be as follows-
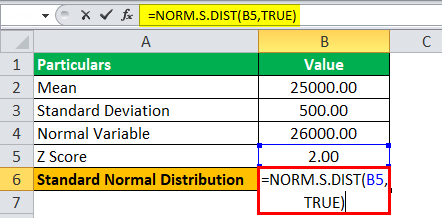
Standard normal distribution will be-
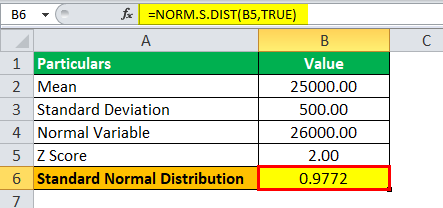
Using the above table of the standard normal distribution, we have a value of 2.00, which is 0.9772, and now we need to calculate for P(Z >2).
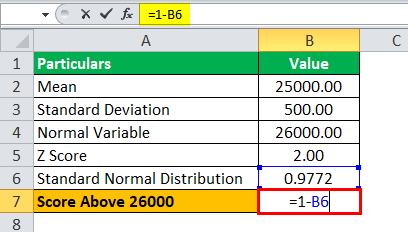
We need the right path to the table. Hence, the probability would be 1 – 0.9772, equal to 0.0228.
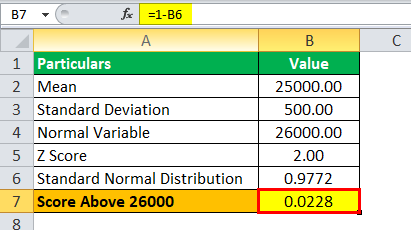
Hence 2.28% of the consumers spend above 26,000.
Relevance and Use
To make an informed and proper decision, one needs to convert all scores to a similar scale. Then, one needs to standardize those scores, converting them to the standard normal distribution using the Z-score method, with a single standard deviation and a single average or the mean. Majorly this is used in the field of statistics and also in the field of finance by traders.
Many statistical theories have attempted to model the prices of the asset (in fields of finance) under the main assumption that they shall follow this kind of normal distribution. However, price distributions mostly tend to have fatter tails. Hence, have kurtosis, which is greater than 3 in real-life scenarios. Such assets observe price movements greater than 3 standard deviations beyond the average or the mean and more often than the expected assumption in a normal distribution.
Frequently Asked Questions (FAQs)
What is the inverse standard normal distribution formula?
x = norminv (p) returns as an output displays the inverse of the standard normal cumulative distribution function (CDF). It is calculated at the probability values in p. x = norminv (p, mu) and returns the inverse of the normal CDF with mean mu and the unit standard deviation. In addition, it is evaluated at the probability values in p.
What is standard normal distribution formula used for?
One may use the standard normal distribution to determine probability. It is a probability distribution. Therefore, the area under the curve between two points shows the variables’ probability of taking on a value range. In addition, the total area under the curve is 1 or 100%.
Is standard normal distribution formula discrete or continuous?
Despite the ongoing normal distribution, it is used to approximate discrete distributions.
Why do we need standard normal distribution formula?
During standardizing a normal distribution, the mean becomes 0, and the standard deviation becomes 1. As a result, it allows you to quickly determine the probability of specific values in the distribution or compare data sets with various means and standard deviations.
Recommended Articles
This article has been a guide to what is a Standard Normal Distribution Formula. We explain its examples to show how to calculate it in the excel template. You can learn more about Excel modeling from the following articles: –