What is Sharpe Ratio?
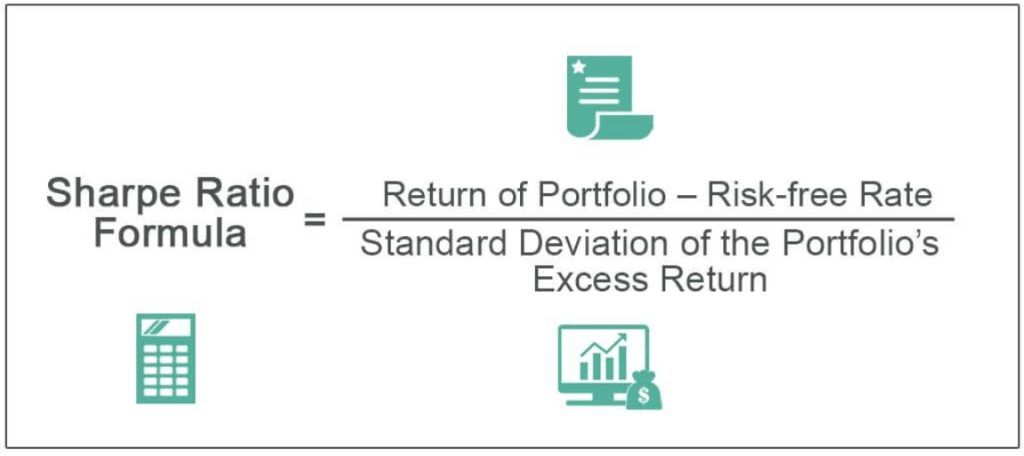
The investors use the Sharpe ratio formula to calculate the excess return over the risk-free return per unit of the portfolio’s volatility. According to the formula, the risk-free rate of the return is subtracted from the expected portfolio return. The resultant is divided by the standard deviation of the portfolio.

A good Sharpe ratio is crucial in investment evaluation, measuring risk-adjusted returns. It helps investors assess investments by considering both returns and volatility, aiding in making informed decisions and comparing different assets or portfolios to achieve a balance between risk and reward. This ratio has a weakness as it can be overstated in a few investment strategies.
Key Takeaways
- The Sharpe ratio formula is used to determine the excess return achieved concerning the unit of portfolio volatility by the investors.
- The formula subtracts the risk-free recovery rate from the expected portfolio return and divides the result by the portfolio’s standard deviation.
- It may also determine if portfolio excess returns result from wise investment choices or excessive risk. As a general rule, risk increases return, and risk decreases return.
- A higher Sharpe ratio is usually preferable to a lower one since it shows that the portfolio selects investments more wisely.
Sharpe Ratio Explained
The Sharpe ratio is a widely used financial metric that helps investors and analysts evaluate the risk-adjusted return of an investment or a portfolio. It was developed by Nobel laureate William F. Sharpe and serves as a tool for comparing the potential return of an investment against its level of risk.
The Sharpe ratio quantifies the excess return earned per unit of risk taken. A higher Sharpe ratio indicates a better risk-adjusted return, meaning that the investment or portfolio is generating more return for each unit of risk incurred. Conversely, a lower Sharpe ratio suggests that the investment is not generating a sufficient return for the level of risk involved.
Investors can use the Sharpe ratio to compare different investments or portfolios and select those that offer a higher return per unit of risk. It helps them assess whether an investment is worth the risk and provides a more comprehensive view of an investment’s performance beyond just its raw return.
However, the Sharpe ratio does have its own limitations. It assumes that returns follow a normal distribution, which might not be the case in reality, especially during extreme market events. Additionally, it relies on the accuracy of expected returns and historical volatility, which can be subject to estimation errors.
The mutual funds Sharpe ratio is a powerful tool for investors to assess the risk-adjusted return of investments. It allows for better decision-making by considering both the potential reward and the level of risk associated with an investment, thus aiding in constructing well-balanced portfolios that align with an investor’s risk tolerance and financial goals.
PE Ratio in Stocks Explained in Video
Formula
Let us understand the formula that shall act as a basis for our understanding of the intricacies of the concept and its related factors.
Where,
- Rp = Return of portfolio
- Rf = Risk-free rate
- σp = Standard deviation of the portfolio excess return.
How to Calculate?
The step-by-step guide has been discussed below that explains how to calculate and find if the investment has a good Sharpe ratio.
- The Sharpe ratio is calculated by dividing the difference in return of the portfolio and risk-free rate by the Standard deviation of the portfolio’s excess return. We can evaluate the investment performance based on the risk-free return.
- A Higher Sharpe metric is always better than a lower one because a higher ratio indicates that the portfolio is making a better investment decision.
- The Sharpe ratio also helps to explain whether portfolio excess returns are due to a good investment decision or a result of too much risk. As the higher the risk higher the return, and the lower the risk lowers the return.
- If one portfolio has a higher return than its competitors, it’s a good investment as the return is high, and the risk is the same. It’s about maximizing returns and reducing volatility. Any investment has a return rate of 15% and zero volatility. Then the Sharpe ratio will be infinite. As volatility increases, the risk increases significantly; as a result, the rate of return also increases.
Let us see the grading threshold of the Sharpe ratio.
- <1 – Not good
- 1-1.99 – Ok
- 2-2.99 – Really good
- >3 – Exceptional
A portfolio with zero risks, like only the Treasury bill, as an investment is risk-free; there is no volatility and no earnings over the risk-free rate. Thus, the Sharpe ratio has zero portfolios.
- Metrics 1, 2, and 3 have a high rate of risk. If the metric is above or equal to 3, it is considered a great Sharpe measurement and a good investment.
- Whereas it is a metric of between greater or equal to 1 and 2 less than 2, it is considered just ok, and if a metric is between greater than or equal to 2 and less than three, then it is considered that it is really good.
- If a metric is less than one, it is not considered good.
Examples
Now that we understand the basics, formula, and how to calculate a mutual fund Sharpe ratio for other such investments, let us apply this theoretical knowledge to practical application through the examples below.
Example #1
Suppose there are two mutual funds to compare with different portfolios having different risk levels. Now let us see the Sharpe ratio to see which performs better.
Investment of Mid Cap stock Fund and details are as follows:-
- Portfolio return = 35%
- Risk free rate = 15%
- Standard Deviation = 15
Hence, the calculation of the Sharpe Ratio will be as follows-
- Sharpe Ratio Equation = (35-10) / 15
- Sharpe Ratio = 1.33
Investment of Bluechip Fund and details are as follows:-
- Portfolio return = 30%
- Risk free rate = 10%
- Standard Deviation = 5
Hence, the calculation of the Sharpe Ratio will be as follows-
- Sharpe Ratio = (30-10) / 5
- Sharpe Ratio = 4
Therefore, the Sharpe ratios of the above mutual fund are as below-
- Bluechip Fund = 4
- Mid Cap fund = 1.33
The blue-chip mutual fund outperformed Mid cap mutual fund, but it does not mean it performed well relative to its risk level. Sharpe tells us below things:-
- The blue-chip mutual fund performed better than Mid cap mutual fund relative to the risk involved in the investment.
- If the Mid cap mutual fund performed as well as the Blue-chip mutual fund relative to risk, it would earn a higher return.
- The blue-chip mutual fund has earned a higher return this year, but as risk is high. Hence, it will have high volatility in the future.
Example #2
Here, one investor holds a $5,00,000 invested portfolio with an expected rate of return of 12% and a volatility of 10%. The efficient portfolio expects a return above 17% and a volatility of 12%. The risk-free interest is 4%. The calculation of the Sharpe ratio can be done as below:-
- Sharpe ratio = (0.12 – 0.04) / 0.10
- Sharpe ratio = 0.80
Sharpe Ratio Calculation in Excel
In the below-given template is the data for the Mid Cap Mutual Funds and Bluechip Mutual Funds for the calculation of the Sharpe ratio.
In the below given excel template, we have used the calculation of the Sharpe ratio equation to find the Sharpe ratio.

Therefore, the calculation of the Sharpe Ratio will be-

Advantages
The advantages of the Sharpe ratio are as follows:
- The ratio is the average return earned more than the risk-free rate per unit volatility or total risk
- Sharpe ratio helps in comparisons of investment.
- Sharpe ratio helps in risk-return comparisons.
- The Sharpe ratio provides a standardized measure of risk-adjusted return, allowing investors to compare investments or portfolios on the basis of their risk-return trade-offs.
- It enables objective comparisons between investments with different risk profiles, facilitating informed decision-making.
- The ratio helps investors strike a balance between maximizing returns and managing risk by quantifying the excess return earned per unit of risk.
- The Sharpe ratio aids in selecting investments that enhance portfolio diversification by evaluating the potential contributions of different assets.
Disadvantages
There are some issues while using the Sharpe ratio as well that do not impress market experts, analysts, and investors alike. Let us understand the disadvantages through the points below.
- It is calculated in an assumption that investment returns are normally distributed, which results in relevant interpretations of the Sharpe ratio being misleading.
- The ratio’s effectiveness can vary based on the choice of the risk-free rate and benchmark, potentially leading to inconsistent comparisons.
- The ratio places relatively higher weight on short-term volatility, which might not accurately reflect an investment’s long-term potential.
- The Sharpe ratio uses historical returns and volatility data, which might not accurately predict future performance, especially in rapidly changing markets.
- The choice of the risk-free rate can impact the ratio’s calculation and interpretation, and real-world risk-free rates can fluctuate.
Sharpe Ratio VS Sortino Ratio
Let us understand the differences between the Sharpe ratio and the Sortino ratio through the comparison below.
Sharpe Ratio
- Measures risk-adjusted return.
- Compares excess return over risk-free rate to total volatility (both up and down movements).
- Benefits higher returns and lower volatility.
- Useful for comparing investments with varying levels of risk.
- Does not differentiate between upside and downside volatility.
- Not suitable for investments where minimizing downside risk is a priority.
Sortino Ratio
- Also measures risk-adjusted return.
- Compares excess return over a specified target (often risk-free rate) to downside volatility.
- Focuses on minimizing downside risk.
- Particularly useful for risk-averse investors.
- Penalizes only downside volatility, ignoring upside volatility.
- Provides a more tailored view of risk-adjusted performance for investments with asymmetric volatility.
Frequently Asked Questions (FAQs)
What is a Good Sharpe Ratio?
Sharpe ratios over one are typically seen as “good,” delivering extra returns compared to volatility. However, investors frequently contrast the Sharpe ratio of a portfolio or fund with that of its competitors or market sector. A portfolio with a Sharpe ratio of 1 may thus be deemed inadequate, for example, if most competitors have ratios above 1.2. A good Sharpe ratio in one situation may be only passable or even worse in another.
What is an average Sharpe ratio?
A diversified portfolio of stock and bond ETFs typically has a Sharpe ratio of 0.5-0.75, where most knowledgeable investors tend to invest.
What if the Sharpe ratio is 0?
A Treasury asset often has a zero Sharpe ratio, which indicates that your returns are identical to your investment’s “risk-free” form.
Can the Sharpe Ratio be used to compare different asset classes?
Yes, the Sharpe Ratio can be used to compare the risk-adjusted returns of different asset classes. However, it’s essential to consider each asset class’s specific characteristics and potential differences in risk and return expectations.
Recommended Articles:
This has been a guide to what is Sharpe Ratio Formula. Here we explain its examples, how to calculate, advantages, and compared it with Sortino ratio. You can learn more about Portfolio Management from the following articles –